A bash script for automatically restarting an unresponsive Apache server only when needed

One of my servers responds to about 100,000 requests per day. Apache would randomly hang a few times a day, taking all of the websites down. I tried every solution I could find online to prevent Apache from hanging, but nothing helped, so I decided to stop wasting time on it and simply develop a good bandage for the problem.

At first I used a script to automatically restart Apache once every two hours. This wasn’t good enough because sometimes Apache would hang multiple times within one hour, other times it would keep running for 12 hours without issue (probably having to do with traffic spikes and waves of spider bots).

Eventually I developed the following script, which restarts Apache only when needed. The script tries to download a page from the website, and if the server fails to respond within 15 seconds, the script assumes Apache is down and restarts it. The script should be run once every minute for eternity.

The script

#!/bin/bash

now="$(date)"

# prevent multiple instances of this script from running
# at the same time. Note that the script's file name is
# auto_restart_unresponsive_apache, update it to match
# whatever file name you use for this script
for pid in $(pidof -x auto_restart_unresponsive_apache); do
    if [ $pid != $$ ]; then
        #Process is already running with PID $pid"
        exit 1
    fi
done

# try to download a webpage from one of the sites on the server.
# we use --head to only download its header, we don't need the page's contents
# we pass a ?t=some_number parameter to the web page, this allows the script
# to bypass web caches like varnish, otherwise Apache could be down but a caching
# mechanism could still return a functional web page for hours

if curl -s --max-time 15 --head http://example.com/?t=`date +%s` | grep "200 OK" > /dev/null
    then
        echo "$now:The HTTP server is up!" > /dev/null
    else
        service apache2 restart
        echo "$now: Restarting apache" >> /var/log/apache_restart_log
fi

The cron job

Below is the cron job I use to run the script once every minute. The output is sent to /dev/null, and any errors are also sent there. Otherwise you could receive emails on the server every time the script runs.

* * * * *  /some_path/auto_restart_unresponsive_apache >/dev/null 2>&1

“The Footsteps of Water” by Sohrab Sepehri (1964)

Sohrab Sepehri

I am a native of Kashan1 My days are not so bad.
I own a loaf of bread, a bit of intelligence, a tiny bit of taste.
I possess a mother better than the leaves of trees.
Friends, better than the water of a running brook.

And a God who is this near:
Within these gillyflowers, beneath that tall pine tree,
Hovering above the awareness of water, above the Law of Foliage.

I am Muslim.
My qiblah2 is a red rose.
My praying spot is a spring, my prayer stone is light.
Plains are my praying mat.
I make ablution with the heartbeat of windows.
In my prayer flows the Moon, flow the colors of the spectrum.
Stones are visible from behind my prayer:
Crystallized are all the particles of my prayer.
I do my prayer when,
Its athan3 wind, from a cypress tree’s minaret, has sung.
I do my prayer to grass’s saying “God is the Greatest”
To the iqama4 of waves.

My Kabaa5 is by the lip of the brook,
My Kabaa is under the acacias.
My Kabaa like the breeze, blows from garden to garden, from town to town.

My Black Stone6 is the brilliance of the garden.

I’m a native of Kashan.
My craft is painting:
Now and then I build a cage with paint, sell it to you
So that with the song of poppies that is imprisoned in it
The heart of your loneliness may cheer up.
What a dream, what a dream…I know
My canvas is lifeless.
I know well, my painting basin contains no fishes.

I’m a native of Kashan.
My descent perhaps goes back
To a plant in India, to an earthen vase from the soil of Sialk7 My descent perhaps goes back to a prostitute in the city of Bukhara8.

My father behind two migrations of swallows, behind two snowfalls,
My father behind twice sleeping in the veranda,
My father behind eras has died.
My father died when the sky was blue,
My mother jumped from sleep unaware, my sister became beautiful.
My father died when the policemen were all poets.
The grocer asked me, “How many melons do you want?”
I asked him, “How much is a happy heart?”

My father used to paint.
He used to make tars9, played the tar too.
He also had a nice handwriting.

Our garden stood on the side of the shadow of wisdom.
Our garden was the interweaving place of feeling and plants,
Our garden was the meeting point of a glance, a cage and a mirror .
Our garden was perhaps, an arc of the green circle of happiness.
The unripe fruit of God on that day, I used to chew in sleep.
Water I used to drink without philosophy
Berries, I used to pick without knowledge.
As soon as a pomegranate used to crack, hands turned to fountains of desire.
As soon as a cello used to sing, the chest burnt from a longing to hear.
Sometimes loneliness used to stick its face to the windowpane.
Passion used to come, and put its arms around the neck of sense.
The mind, used to play.
Life was something, like a rainfall during Eid, like a plane tree full of starlings.
Life at that time, was a line up of light and dolls,
It was an armful of liberty.
Life at that time, was a music basin.

The child, slowly, walked away along the alley of dragonflies.
I packed my things, went out of the city of carefree fancies
With my heart filled with homesickness for dragonflies.

I went to the party thrown by the world:
I, to the field of grief,
I, to the garden of mysticism,
I, to the illuminated veranda of knowledge, went.
I climbed up the stairs of religion.
To the end of the alleyway of doubt,
To the cool air of self-sufficiency,
To the wet night of love and affection.
I went to see someone who was at the other side of love.
I went, I went until women,
Until the lantern of pleasure,
Until the silence of desire,
Until the flapping sound of the wings of loneliness.

I saw things on the face of the Earth:
I saw a child who was smelling the Moon.
I saw a door-less cage in which brilliance was flapping its wings.
I saw a ladder on which love ascended to the roof of heaven.
I saw a woman who was pounding light in a mortar.
Lunch on their table was bread, was vegetables, was the distance of dew, was the hot bowl of affection.

I saw a beggar who was walking door to door begging for the song of a lark
And a sweeper who was praying to the rind of a melon.

I saw a lamb that was eating a kite.
I saw a donkey who understood hay.
In the meadow of Advice I saw a cow, satiated.

I saw a poet who, when he talked, he addressed a lily as “Your Highness.”

I saw a book, its words all of the make of crystal.
I saw a sheet of paper, of the make of spring,
I saw a museum far away from grass,
A mosque far away from water.
Above the bed of a hopeless scholar, I saw a vase, overflowing with questions.

I saw a mule whose burden was Essays.
I saw a camel whose burden was the empty basket of Proverbs.
I saw a mystic whose burden was tanana ha ya hoo10

I saw a train that was carrying brilliance.
I saw a train that was carrying knowledge and so torrentially it went.
I saw a train that was carrying politics (and so emptily it went.)
I saw a train that was carrying seeds of lotus and the song of canaries.
And an airplane, which on that height of thousands of feet,
through its windows the soil was visible:
the topknot of hoopoes,
The spots of a butterfly’s wings,
A frog’s reflection in a pond,
And the passage of a fly from the alleyway of loneliness.
The clear desire of a sparrow, when from a plane tree it comes toward the ground.
And the maturation of the Sun.
And the beautiful love making of a doll with the morning.

Stairs that ascended to the greenhouse of lust.
Stairs that descended to the cellar of alcohol.
Stairs that ran to the Law of Corruption of Red Roses
And toward the understanding of Mathematics of Life,
Stairs that ran to the roof of enlightenment,
Stairs that ran to the platform of manifestation.

My mother down there,
Was washing the cups in the stream’s memory.

The city was visible:
The geometrical growth of cement, steel, stones.
The pigeonless roofs of hundreds of buses.
A florist was putting up his flowers for sale.
Between two jasmine trees a poet was hanging a swing.
A boy was throwing stones at the wall of School.
A child was spitting plum stones upon dad’s faded praying mat.
And a goat was drinking water from the Caspian Sea of a map.

A laundry-line was visible, a restless brassiere.

The wheel of a cart longing for the horse to become weary,
The horse longing for the carter to sleep,
The carter longing for death.

Love was visible, waves were visible,
Snow was visible, friendship was visible.
Words were visible.
Water was visible, and the reflection of things in water.
The cool shade of cells in the heat of blood.
The moist side of life,
The east of sorrow in the human heart.
The season of drifting in the alley of women.
The scent of solitude in the alley of seasons.

A fan was visible in the hand of summer.

The seed’s journey to flowering.
The ivy’s journey from this house to that house.
The moon’s journey into the pond.
The eruption of flowers of regret from the soil.
The falling of young vine from the wall.
The raining of dewdrops on the bridge of sleep.
The leaping of joy from the ditch of death.
The passing of events behind words.

The battle of a pit with the light’s desire.
The battle of a stair with the long leg of the Sun.
The battle of solitude with a melody.
The beautiful battle of pears with the emptiness of a basket.
The bloody battle of pomegranates with the jaws.
The battle of Nazis with branches of delicacy.
The battle of a parrot and eloquence.
The battle of the forehead with the coldness of prayer-stones.

The attack of the mosque tiles on prostration.
The attack of wind on the ascension of soap bubbles.
The attack of the army of butterflies on the program of Pest Control.
The attack of dragonflies on the class of pipelayers.
The attack of reed pens on leaden letters.
The attack of a word on a poet’s jaw.

The opening of a century by a poem.
The opening of a garden by a starling.
The opening of an alley by an exchange of greetings.
The opening of a town on the hands of three or four wooden horsemen.
The opening of a New Year by two dolls, one ball.

The murder of a ratchet on the mattress in the afternoon.
The murder of a story at the entrance of the alley of sleep.
The murder of a worry by the instruction of songs.
The murder of moonlight by the command of neon lights.
The murder of an oak tree by the hands of government.
The murder of a depressed poet by a chimonanthus11.

All was visible on the surface of the earth:
Order was walking in the alley of Greece.
An owl was howling in the Hanging Gardens12.
The wind was blowing a sheaf of history’s straws on Khyber Pass13 towards the east
On the serene lake of Neghin, a boat was carrying flowers.
In Banares14, at the entrance of each alley an eternal lamp was burning.

Peoples I saw.
Towns I saw.
Plains, mountains I saw.
Water I saw, soil I saw.
Light and darkness I saw.
And plants in light and plants in darkness I saw.
Creatures in light, creatures in darkness I saw.
And humans in light, and humans in darkness I saw.

I’m a native of Kashan, but
My city is not Kashan.
My city is lost.
I, with endurance. I, with fever,
Have built a house on the other side of nighttime.
In this home I am close to the humid anonymity of grass.
I hear the sound of the breathing of the garden.
And the sound of darkness, when it drops from a leaf.
And the sound of brightness, coughing from behind a tree,
The sneezing of water from every crack of rock,
The dripping of swallows from the ceiling of spring.
And the clear sound of opening and closing of the window of loneliness.
And the pure sound of the mysterious moulting of love,
The concentration of the passion for soaring in wings
And the cracking of the soul’s self-restraint.
I hear the footsteps of longing,
And the methodical footsteps of blood in the veins,
The pulsing of the dawn of the pigeons’ well,
The beating of the heart of Friday night,

The flowing of carnations through thoughts,
The pure neighing of truth from afar.
I can hear the sound of the blowing of matter,
And the sound of the shoe of faith in the alley of excitement.
And the sound of rainfall on the wet eyelids of love,
On the sad music of adolescence,
On the song of pomegranate orchards.
And the sound of the shattering of the bottle of joy at night,
The tearing of the paper of beauty,
And the wind filling and emptying the cup of nostalgia.

I am near to the start of the Earth.
I take the pulse of flowers.
I am familiar with the wet fate of water, the green habit of trees.

My soul is flowing in the new direction of things.
My soul is young.
My soul sometimes, from excitement, gets a cough.
My soul is jobless:
Raindrops, the cracks in bricks, it counts.
My soul sometimes is as real as a stone on the road.

I didn’t see two poplars in enmity.
I didn’t see a willow selling its shade to the ground.
For free it offers, the willow its branch to the crow.
My passion blossoms wherever a leaf exists.
A poppy bush has bathed me in the surge of being.

Like the wings of insects I know the weight of dawn.
Like a vase, I listen to the music of growth.
Like a basketful of fruit, I have strong fever for ripening.
Like a tavern, I stand on the border of languor.
Like a building at the lip of the sea I am anxious about the high eternal waves.

Sunshine as much as you want, union as much as you want, increase as much as you want.

I am content with an apple
And with smelling a chamomile bush.
I with a mirror—a pure connection—am content.
I will not laugh if a balloon bursts,
And I will not laugh if a philosophy halves the Moon.
I know the sound of the flapping of a quail’s wings,
The colors of a bustard’s belly, the footprints of a mountain goat.
I know well where rhubarbs grow,
When starlings come, when partridges sing, when falcons die,
What the Moon is in the dream of a desert,
Death in the stem of desire,
And the raspberries of pleasure, in the jaws of love-making.

Life is a lovely ritual.
Life has wings as vast as death,
It has a leap the size of love.
Life is not something that, on the windowsill of habit, to be left forgotten by you and me.
Life is the rapture of a hand that reaps.
Life is the first black fig in the acrid mouth of summer.
Life is the dimensions of a tree from the eyes of an insect.
Life is the experience that a bat has in the dark.
Life is the homesickness that a migrating bird feels.
Life is the whistle of a train that turns through the dream of a bridge.
Life is observing a garden from the obstructed windows of an airplane.
It is the news of the launch of a rocket into space,
Touching the loneliness of the Moon,
The notion of smelling a flower on another planet.

Life is the washing of a plate.

Life is finding a penny in the brook of the street.
Life is the square root of a mirror.
Life is a flower to the power of eternity.
Life is the Earth multiplied by our heartbeats.
Life is the simple and monotonous geometry of breaths.

Wherever I am, so let me be,
The sky is mine.
The window, thinking, air, love, the Earth are mine.
What importance does it have then,
Sometimes if they grow,
Mushrooms of nostalgia?

I, don’t know,
Why some say, “Horses are noble animals, pigeons are beautiful.”
And why there is no vulture in any person’s birdcage.
What do clovers lack that red tulips have?
Eyes should be washed, in another way we should see.
Words should be washed.
A word in itself should be the wind, a word in itself should be the rain.

Umbrellas we should shut.
In the rain we should walk.
Thoughts, and recollections, should be carried in the rain.
With all the people of the town, in the rain we should walk.
A friend, in the rain we should call on.
Love, we should seek in the rain.
In the rain we should sleep with women.
In the rain we should play.
In the rain we should write things, speak, plant lotuses.
Getting drenched from time to time,
Swimming in the pond of right now, is what life is.

Let us undress:
Water is one foot away.

Let us taste brilliance.
Weigh the night of a village, the sleep of a deer.
Let us feel the warmth of a stork’s nest,
Tread not on the Law of Lawn,
Loosen the knot of tasting in the vineyard.
And open our mouthes if the Moon emerges.
And not say that night is a bad thing.
And not say that the shining moon is unaware of a garden’s eyesight.

And Let us bring baskets.
Take all this red, all this green.

Let us have bread and cheese in the mornings.
And plant a sapling at every turn of a sentence.
And pour the seed of silence between two syllables.
Let us not read a book in which the wind doesn’t blow,
And a book in which the surface of dew is not wet,
And a book in which cells don’t have dimensions.
Let us not wish the mosquito would fly off the fingertip of nature.
And not wish that the leopard would go out of the door of creation.
And let us understand that if worms didn’t exist, life would have lacked something.
And if caterpillars didn’t exist, the Law of Trees would have suffered a blow.
And if death didn’t exist, our hands would have sought something.
And let us know if light didn’t exist, the living logic of flying would have gone astray.
And let us know that before corals, a void was being felt in the thoughts of the seas.

And let us not ask where we are,
Let us smell the fresh petunias of the hospital.

And let us not ask where the fountain of luck is.
And let us not ask why the heart of truth is blue.
And let us not ask what breezes, what nights the fathers of our fathers enjoyed.

Behind our backs there isn’t a thriving space.
Behind our backs no bird sings.
Behind our backs no wind blows.
Behind our backs the green window of poplars is closed.
Behind our backs dust has settled over the whirligigs.
Behind our backs what there is is the weariness of history.
Behind our backs the memory of waves throws cold shells of silence on the coast.

Let us go to the lip of the sea,
Cast nets,
And catch freshness from the water.

Let us pick up a pebble from the ground,
And feel the weight of existence.

Let us curse not the Moonlight if we have fever,
(Sometimes I have seen in fever, the moon descends,
The hand can touch the ceiling of heaven.
I have noticed that the goldfinch sings better.
Sometimes a wound that I have had under my food,
Has taught me the ups and downs of the ground.
Sometimes in my sickbed the size of a flower has multiplied,
And increased it has, the diameter of an orange, the radius of a lantern.)
And let us not fear death.
(Death is not the end of the pigeon.
Death is not a cricket’s inversion.
Death flows in the soul of acacias.
Death has a seat in the pleasant climate of thinking.
Death in the spirit of the village’s night speaks of morning.
Death with a bunch of grapes comes into the mouth.
Death sings in the red larynx of the throat.
Death is responsible for the beauty of a butterfly’s wings.
Death sometimes picks basil.
Death sometimes drinks vodka.
Sometimes it is in the shade watching us.
And we all know,
The lungs of pleasure, are full of the oxygen of death.)

Let us not shut the door on the alive speech of appreciation which we hear from behind the wattled twigs of sound.

Let us remove the curtain:
Let us allow feeling to get some fresh air.
Let us allow adolescence to dwell under any bush it wishes.
Let us allow instinct to play.
To take off its shoes and following the seasons, leap on the flowers.
Let us allow solitude to sing.
To write things.
To go to the street.

Let us be simple.
Let us be simple whether at a teller’s window or under a tree.

It is not our job, discovering the secret of the red rose,
Our job maybe is
To, in the charm of the red rose, become swimmers.
To camp behind wisdom.
To wash hands in the rapture of a tree leaf before sitting at the dining table.
In the mornings when the sun, rises let us get born again.
Let us let our excitements fly.
Let us upon the perception of space, color, sound and the window sprinkle water .
Let the sky settle between two syllables of existence.
Let us fill and empty our lungs with eternity.
Take the load of knowledge off the shoulders of the swallow.
Let us reclaim the name from clouds,
From plane trees, from mosquitos, from summer.
On the wet feet of rain let us climb to the heights of compassion.
Let us open the door on mankind, light, plants and insects.

Our job maybe is
Between the lotus flower and the century
To run after the song of truth.

Kashan, village of Chenar (plane tree), summer of 1343 (1964)
Translated from Persian by Ikram Hawramani, Slêmanî, Iraq, 2008.

Please note that some of the translations might be too literal and may fail to transmit the poetic significance of the poet’s word and phrase choices.

“So Intoxicated I Am” by Jalal al-Deen Rumi

So intoxicated I am, so intoxicated I am today,
That out of my hoop I have leapt today!

Such a thing that cannot be imagined,
That’s how I am, that’s how I am today!

In spirit out to the Heaven of Love I went,
Though in body still in this world I am today!

I took reason by the ear and said, “Out!
Get out of here! Free of you I am today!

“O reason, wash your hands of me!
For one with the Madness of Love I am today!”

That beautiful Yusuf has given me an orange,
For both of my hands I have cut today!

To such a state it has brought me that cup of wine,
That so many vats of wine I have smashed today!

I know not where I am, but surely,
In a station of blessedness I am today!

Good fortune came coyly to my door and I,
Out of intoxication closed my door on him today!

When he returned, after him I ran,
Not for one minute did I sit down today!

Now that my “We Are Nearer” has concluded,
No more will I worship myself today!

Do not tie up that tress, Shams al-Din-e-Tabriz,
For like a fish in that net of yours I am today!

Translated from Persian by Ikram Hawramani, March 2017.

Below is this poem as sung by Shajarian. The word “today” has been replaced with “tonight” in the song, and some of the verses are omitted:

87 to Socrates

If you had a list of your ancestors and went back through them to your 87th ancestor, you will reach a man and woman who lived around the time Socrates was born.1

This chart below shows how unimportant we are. In 1000 years we will be just another number on someone else’s timeline. It also shows how important we are. If any of these men and women had failed to reproduce, the chain would have been broken and we wouldn’t exist today.

Why pupil size is associated with intelligence

People of higher intelligence have wider pupils than people of lower intelligence. A possible reason for this is that a wider pupil allows more photons to enter the retina. A person of higher cognitive capacity will be able to make good use of these photons, as they have the hardware to analyze the added photons, meaning the increase in the amount of photons entering the retina provides a selective advantage for these people.

In other words, when high intelligence is paired with wider pupils, human vision becomes more powerful, as there is more visual data received, and there is the power to process these data. By taking in more photons, these people are able to have better distant vision (as their pupils offer a wider surface area for distant photos to be captured) and better peripheral vision, giving them an advantage in hunting, warfare, and perhaps most importantly, social learning. If Kevin Laland’s theory is true that teaching and social learning are the reason our big brains developed, then better vision would have been crucial to this process and would have been selected for. Better visual fidelity would have enabled better ability to learn from the facial expressions of other humans and see their fine hand movements in things like tool-making. It would have also enabled better learning and data-gathering at a distance, so that a person could learn important information even from unfriendly individuals by watching them from a distance.

The theory, therefore, is that higher intelligence and wider pupils together enable humans to have higher visual fidelity compared to other humans. Add this to the much faster reaction times of a high IQ person and you have a person who is better than others at social learning and data-gathering and better at hunting as well.

Failing empire barks

How dare a sovereign state develop weapons technology that could prevent the American Empire from subjugating them and turning them into a client state?

For China the cat is out of the bag, so the US has to bark at North Korea and Iran and ask for China’s help in intimidating these countries.

And of course, something has to be done about the Iranian threat. Look how close to our military bases they have put their country:

Why God Allows Evil to Exist, and Why Bad Things Happen to Good People

Introduction

There is a surprising amount of confusion among the religious, even among clerics and scholars, when it comes to understanding why evil exists and why God stands aside when so much suffering happens throughout the world. Most of us express wonder when we see some horrible catastrophe happen, or when we see evil individuals, companies and institutions wield so much power. Some people even go so far as to blame God for the evil things that exist in this world, since if God had desired, He could have prevented such things from existing or happening in the first place. Others take this even further, using the existence of evil as proof of God’s non-existence. How can a good and supposedly all-powerful God stand by while so much evil happens? Where is our God?

There are good, perfectly logical explanations for these things, deep explanations that elucidate the purpose of this universe, our place in it, and our relationship with God, and through this give us perfectly good reasons for the existence of evil.

Why Evil Exists

What is the point of the existence of this world anyway? Many mistakenly think that the purpose of this world is to be a permanent residence where people judge whether God exists or not. They think that they can gauge God’s “level” of existence by the things that happen around them, so that given the right set of events, they will decide He is alive and active, and given others, they will decide He doesn’t exist, because if He existed, the world wouldn’t be the way it is.

A friend said that he once went on a trip abroad, and before he left, he asked God to protect three things that were most important to him in his life. During his trip, he lost all three, which included the dying of loved ones, and this made him decide that God doesn’t exist. He is a Buddhist now.

The above case is an example of earth-centric thinking, that considers this world a goal in itself. This is the core mistake that leads to millions of people misunderstanding, even disliking, God. That is a mistake because this world is nothing besides a testing hall where humans can freely choose to do as they like, to prove their worthiness of God’s approval or wrath. This world is not meant to be a permanent residence.

Most religions teach that an end of the world is coming. Regardless of religion, the universe is on track to become a dark, lifeless mass as the stars and galaxies die out. Everything is going to end, and what remains is the record of our deeds, kept by God. Even if we manage to create the greatest empire on earth, or write the most wonderful novel, none of our accomplishments will last.

One day the universe will shut down as if it never existed, and on that day what significance can our achievements have? This world is not meant as a permanent home of peace, but as a test. And a test requires that the possibility of failure should exist. If all humans acted according to God’s wishes, evil would not exist. But since God has given humans the freedom to disobey Him, they have the ability to do evil.

God is good, and evil is the absence of goodness, the same way that darkness is the absence of light. If God is Light, we cannot blame Him for the darkness we encounter when we turn away from Him, distance ourselves from Him, and act against His wishes.

Why didn’t God make the universe a place of wholesome goodness lacking in the possibility for evil? Because if evil could not exist, humans wouldn’t truly be free beings.

To be free, humans require the freedom to act against God along with the freedom to act for His sake. God wants to give humans perfect freedom to act and grow, so that they can be the best or the worst they want to be. Since humans have the freedom to act against God, and since to act against God is to create evil, humans have been given the freedom to create evil.

God did not make this world a perfect place because that is not its purpose. Imagine if you were a maker of creatures. If the creatures you made were controlled by their nature to do exactly what you put in them to do, they could never be truly your friends. They would be subservient robot-like machines that cannot help doing whatever you put in them to do.

But imagine if one day you wanted something more. You wanted to make creatures that could truly be your friends. The only way to have a true friend is to create a creature that can choose whether to be your friend or not. And so, you make creatures with free will, who can act according to whatever they wish, rather than according to your programming. Some of these creatures will choose to be your friends, others will ignore you, others will choose to be your enemies. They may fight among themselves, doing much evil to one another, and blaming you, their creator, for the evil they do, when in truth they should blame themselves, for they are the ones choosing to act the way they do. They have the freedom to be good, and many of them choose to be good, but some of them  choose to be evil instead.

The only thing we can blame God for is His creating us and giving us the freedom to be evil. This is a pointless blame. This is our reality and our fate, we cannot escape it. We have been thrown into this game regardless of our wishes, a game that forces us to choose to be either good or evil. We can debate the ethics of forcing people to choose between good and evil. But at the end of the day, we are forced to play this game. There is no dropping out.

Our Creator has done this to us, possibly against our will1, but we cannot get hung up over this fact, because our future holds something very important: Either eternal reward, or eternal punishment. Blaming God will not help our future. It may make us feel better now to hate God as so many do, but by making us think badly of God, this will reduce our chances of future success. The future is coming whether we want it to or not, and we have the power to make it a good or a bad future.2

Not all evil is done by humans. Droughts, floods and other natural disasters can cause much evil and suffering, and we can lose loved ones through car accidents and illnesses. Why doesn’t God prevent these things from happening if He loves us? Because, in order for the testing hall that is this world to be a true and consistent place of testing, God shouldn’t interfere with the functioning of nature3. The laws of nature should behave in such a way that makes sense even without reference to God. If we were as intelligent as we are, and yet we saw that nothing bad ever happened on earth, no car accidents, to illnesses, nothing, that everyone died in old age of natural causes, then this would be undeniable evidence of the existence of a higher power that protects humans.

God wants us to have the possibility of being atheists. It is one of God’s self-imposed rules that it should be impossible to directly detect His existence. And that requires that the functioning of this world should make perfect sense according to predictable scientific laws.

God wants us to believe in Him without seeing Him or knowing that He truly exists, because if it were possible to prove His existence, it would reduce our freedom to act against Him. God wants our universe to seem to make perfect sense without any necessity for His existence. This way we are given the freedom to discover Him and His Scriptures, and through our knowledge and conscience, we gain the ability to either follow His way or disbelieve in Him. Once we are given this knowledge, there is no turning away from the choice between good and evil.4

God wants our test to be a perfect test, in which we have perfect freedom to be good or evil. This would allow us to take credit for our actions. If God’s existence were proven, we’d be turned into slaves who cannot help but do as He says. We’d become merchants who act in our best interests by following God’s commandments. This is not what God wants. God wants us to be honored creatures who befriend Him not because we are forced to, but because we choose to. This is what gives worth to our friendship.

There is little honor in an employee acting according to his or her boss’s wishes, this is the expected behavior. While even this amount of obedience to a boss justifies reward, so that even if we had proof of God’s existence, we could still be rewarded for obeying Him5, God wants to take us beyond this boss-employee relationship. He wants to raise us to the status of honored friends, who act out of love and friendship, and out of our own efforts toward remembrance of God, rather than acting out of practical compulsion.

God wants us to be the servant who continues to love and serve his master, even though the master goes away for years, decades. What incredible honor and reward can await such a servant who faithfully loves and serves his absent master for 50 or 60 years, until he dies, even though the master never returns?6

God, by creating the possibility for the existence of true friendship between Himself and the humans He created, had to also create the possibility for the existence of true enmity between Himself and them. He wanted friends, but He knew that they couldn’t truly be called friends unless they had the option to be His enemies.

The evil done by humans on Earth is a doing of humans when they act against God, it is not a doing of God, therefore humans should be blamed, not God. And the evil done by nature is nature’s own doing, caused by the rules of physics, and God does not want to interfere with it because constant interference with nature would cause His existence to become apparent. It is necessary for disasters and accidents to be possible, as these prove to us the validity of nature’s rules, and allows the atheist the freedom to use these to prove that God doesn’t exist.

God and Nature shall always be apart, or seem to be apart, so that each one appears to function without the other. This is necessary, as this is what enables humans the freedom to choose between faith and disbelief, between good and evil. The world needs to make perfect, logical sense without having to refer to God in our thinking. It should be possible for us to believe that the world functions on its own without anything supernatural existing, this is what gives us the freedom to believe and disbelieve in God.

We need to be able to believe that the Master is absent. This is when the true nature of the servant comes through. Bad servants start to misbehave as soon as the Master looks away, and if the Master is away long enough, they entirely give up serving Him. They will start to loot His property and defile His name. But the good and honorable servant, even as he sees all of this happen, continues to have love and loyalty toward his Master. It makes no difference to him even if the Master never comes back. He keeps the remembrance of his Master in his heart, and he admonishes and encourages himself to continue to be the best servant he can be.

The world, the way it is, gives us the perfect opportunity to be this honorable and admirable servant. If evil did not exist, and if bad things did not happen, then there would have been no way for such servants of God to exist. We’d instead all be lowly and menial servants who never had a chance to disobey, and thus never had a chance to prove our loyalty toward God.

A world without evil and disaster would be a dysfunctional testing hall that cannot differentiate between the best and the worst of us. Without evil and disaster, God’s existence would be so clearly visible to us that most of us would cower in front of Him. A few people might be found who are daring enough to disobey God even in such circumstances, but the majority of people would kneel before God as they would before a great emperor, regardless of whether they had any loyalty toward Him.

A world that seems to be ruled by the cold, harsh laws of nature, and that completely hides the existence of God from our eyes, gives us the perfect opportunity to prove our loyalty to God. This world, with all of its problems, is the perfect testing hall, because of the problems it has.

Why Bad Things Happen to Good People

I will get around the metaphysical complexity of defining good and bad people by saying that a good person is anyone the reader thinks does not deserve to suffer, while a bad person is someone who does not deserve God’s protection.

Why good people suffer has already been mostly answered. If bad things never happened to good people, this would act as a proof of God’s existence and the invalidity of nature’s laws. If all good people lived to old age and died of natural causes, this would be easily detectable by even the simplest analysis.

There are religious people who wrongly think that if you are truly faithful, you will never suffer anything bad. When they see bad things happen to people, they try to find the reasons why the sufferers themselves are responsible for the suffering that has come upon them.

But disasters are a natural part of life, and it should affect good and bad people equally, or at least it should seem to do so. God does not want to be seen, so it should be impossible to detect miracles happening to save good people.

The suffering of good people proves that nature’s laws are real. If nothing bad ever happened to good people, but only happened to bad people, the fact would act as a proof of God’s existence, and this is what God does not want in this world. God wants us to follow Him and serve Him of our own free will, without any compulsion or strong inducement.

There would be millions, maybe billions, more believers if avoiding suffering was as simple as believing in God and serving Him. But these believers would be tantamount to fair-weather friends, who are on the bandwagon of faith only for their own immediate, short-term interest. They wouldn’t be loyal friends of God.

The world should occasionally give the faithful the impression that God has abandoned them. This is the true test of faith. Once all blessing seems to have gone from our lives, that’s when we look inside our hearts to find God again. If we weren’t true believers, if we only believed in God to ensure our own worldly good, then there would be no God in our hearts. We’d lose faith and abandon religion once we had the impression that God has abandoned us, like millions do.

But as for the truly faithful, when life gives us the impression that God has abandoned us, we continue to believe in God and to do our best to protect our faith. If our Master seems absent, it does not mean He has gone away forever. Only a dishonorable servant would start to act as if the Master is dead once He is gone away for a month or two. Those of us who truly believe in God, who love Him and want His friendship, and who have accepted to be His servants for eternity, will not abandon serving Him, regardless of what hardship and loneliness comes our way.

By the morning brightness

And [by] the night when it covers with darkness,

Your Lord has not taken leave of you, nor has He detested [you].

And the Hereafter is better for you than the first [life].

And your Lord is going to give to you, and you will be satisfied.

Did He not find you an orphan and give [you] refuge?

And He found you lost and guided [you],

And He found you poor and made [you] self-sufficient.
[Quran 93:1-8]

The possibility of good people suffering something horrible is nothing but an extension of these facts of life; the need for a proof of nature’s laws, the necessity for some suffering to prove one’s faith and virtue. God can inflict the greatest suffering on His most beloved servants, as He did with Abraham when He asked him to slaughter his beloved son, and as He did was Jacob in allowing him to believe, for years on end, that his most beloved son was dead, as this is how the greatest friends of God are raised to the highest ranks.

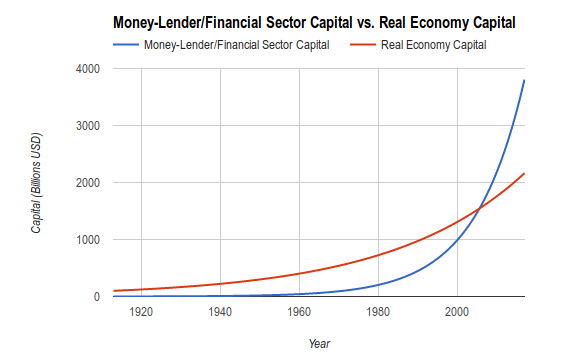
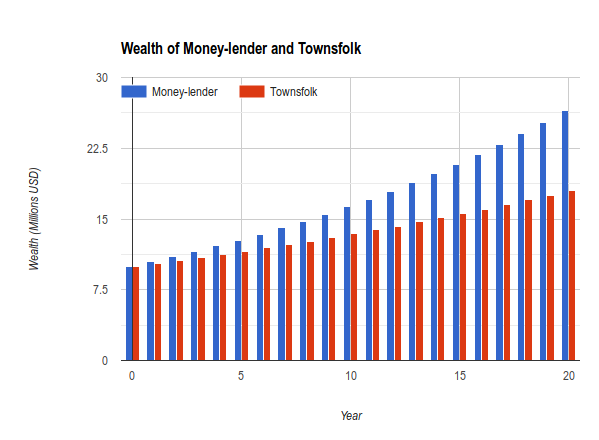
There can never be virtue without suffering. A virtuous act is one where we overcome our natural tendencies for the sake of God, and attaining virtue always has an element of suffering in it, small or great. A rich person who, out of love for God, refuses to practice usury to further enrich himself or herself, is doing a virtuous thing. Their suffering is that they watch their fellow rich men and women practice usury and see their wealth increase exponentially, while their own wealth increases slowly and is subject to far more risk.

And someone who attains virtue by working for a charitable cause, or by giving money to the poor, is also subject to a mild form of suffering (what economists would call “opportunity cost”), as they lose time and money that could have been used for something pleasurable.7

The possibility of good people suffering does not mean that blessedness in this world does not exist. As in the story of Joseph, God will allow suffering to happen, followed by periods of ease and enjoyment, followed by more suffering, until His servant is raised to the highest possible status. God will not leave his faithful servants abandoned alone to be entirely subject to the cold, harsh laws of nature, though it is necessary that it should appear so, so that God’s existence will not become apparent. The Quran says:

Whoever does righteousness, whether male or female, and who is a believer - We will surely cause him to live a good life, and We will surely give them their reward [in the Hereafter] according to the best of what they used to do.
[Quran 16:97]

Besides reward in the afterlife, the verse promises a good worldly life. The word used in the verse to mean “good” is tayyib, which can also be translated as “wholesome”. God will have a hand in the lives of good people, ensuring that despite the disasters they suffer, they will end up having wholesome, blessed lives. This, of course, cannot be proven, in accordance with God’s plan. But it can be seen in little things for those of us who have faith. The lives of believers seem to have more purpose. Their life stories seem better arranged and guided. This of course cannot be proven to an atheist, and it doesn’t have to be.

On the other hand, for disbelievers, people who knowingly rebel against God even though they believe in Him in their hearts, the Quran has this to say:

But whosoever turns away from My Remembrance, verily for him is a life narrowed down, and We shall raise him up blind on the Day of Judgment. He will say: "My Lord, why have you summoned me as a blind person when I was sighted?" He will say: "Thus did Our signs come to you, and you forgot them; that is why you have been forgotten this Day."
[Quran 20:124-126]

This verse, similar to the previous one, implies that there are worldly consequences for having (and in this case, not having) faith. Those who knowingly reject God will have a “narrowed down” life, also translated as “straitened” and “constricted”. Similar to how the lives of good people are blessed despite their hardships, the lives of evil people are constricted despite their joys and pleasures.

To put it another way, the general theme of a believer’s life is blessedness, while the general theme of a disbeliever’s life is constrictedness, a feeling of being oppressed by life. Both will enjoy periods of joy and periods of suffering, but through submitting to God, believers are blessed by God and are freed from many of the constraints of life, while disbelievers are, in general, and not very detectably, made to submit to the harshness and coldness of nature.

There will be a hidden hand of God that shields and guides the believer, while there is no such shield and guide for the disbeliever, and the world, itself a servant of God, treats them the way they like to be treated, as if God does not exist.

God could inspire us to always make the right choices in order to avoid all that is bad and to always gain what is good. But, besides making God’s existence apparent, this would reduce the value of our friendship with Him. A true friend of God is the one who keeps his faith in Him during difficulties, while a fair-weather friend of God is the one who only loves and worships God during times of peace and plenty, and whose faith is shaken whenever something bad happens to them (and plenty of such believers do exist).

The matter of ranks of God’s chosen friends in the afterlife is important, because it decides a person’s status in the afterlife for all of eternity. God does not want most of us to leave this world without having proven how good of a friend of God we are. That, in fact, is the main purpose of this world: To distinguish our ranks, from the very best of us to the very worst.

Some people die before they can prove themselves to God, for example infants. God allows this to happen because infant deaths are required by the laws of nature. And as for the poor infant, while their death is a tragedy in this life, in the afterlife God can choose to give them great reward without them having worked for it, since God’s generosity is not limited. He may also give them a higher status in the ranks of His friends than their parents as a reward for the parents, while also raising the status of the parents who kept their faith during the ordeal. A truly just God will not let an infant’s death go to waste.8

There are a thousand ways in which God can preserve eternal justice while allowing tragedies like infant deaths to happen, since this life is no more than a mere flicker compared to the eternity of the afterlife, and everything that happens here will one day be nothing more than a pale memory when a person has spent millions of years enjoying the rewards of the afterlife, close to family and friends and close to God.

Suffering is a natural part of a believer’s life. God does not ask us to stoically control our emotions, never letting any suffering show, to prove that we are faithful. Jacob was a prophet of God, and yet he cried so much after his son was believed dead that his eyes turned blind. There is no shame in sadness. God does not ask us to be super-human, but to keep faith alive in our hearts as we are subjected to life’s joys and sorrows.

Isn’t it Unkind for God to Punish His Creatures?

Think of God as Light. By staying close to Him, by following His commandments, we ensure our eternal good. No one is perfectly close to Him, each person is at some degree of distance. Eternal punishment is only for those who knowingly stray so far away from the Light that they knowingly wallow in complete darkness. Anyone who stays within the merest flicker of Light may gain God’s forgiveness and eternal reward.

Eternal punishment is necessary because that is the only way of ensuring that evil-doers don’t get away with their evil deeds. Many Jews (and Christians too) have become corrupted by the idea that they are God’s chosen children and that no matter what they do, they will eventually be forgiven. This is a highly dangerous thing to believe, because once you believe that you will never be punished eternally, then you can get away with anything. If you are an Israeli settler, who cares if you take over other people’s lands with violence. You are God’s Chosen, and you will be forgiven.

Once the idea of eternal justice is corrupted, then from that all evil follows. Even if people believe in an afterlife, if they think that there will be a limit on their punishment term, that they will burn for a thousand years and then will be freed to enjoy life for the rest of eternity, then many of them will not find it so bad to devolve utterly into sin, since they will eventually get away with it.

To preserve justice, people should not be able to get away with their crimes. During their lifetimes God gives them thousands of opportunities to repent and become better people. God believes that a human lifetime is sufficient to distinguish good people from bad, that it contains enough opportunities for humans to prove whether they deserve eternal good or eternal punishment. Every hour of every day contains opportunities for us to change, for better or for worse, and these small changes mount. There is a Light in this world and we can choose to either walk toward it or away from it every hour of every day. Every time we take a step away from it, we do it in the full knowledge that we have the chance to take a step toward it instead.

If we spend all of our lifetimes walking away from the Light by knowingly doing evil, we shouldn’t be surprised when one day we find ourselves in total darkness, hopeless of ever finding the Light again. It was our own choices that brought us here. For years and decades we had the option to turn back and walk toward the Light again, our consciences kept reminding us that we still had a chance to return to God, that God’s door was wide open to us, but instead we decided to keep walking away, chasing our shadow instead of chasing the Light.

Once a person falls into total darkness through their own choices, there will no longer be a point to extending their lives to let them come back. This is what Scripture claims, that once a person is totally surrounded by their evil deeds, they will never come back toward the Light. There is a point of no return, meaning that a person who crosses this point, even if given a lifetime of a hundred thousand years, it will not make a difference in their fate.

In fact, the Quran claims that such evil people, even if taken to the afterlife and shown all of the signs of God’s greatness, then brought back to earth, they will continue to be evil. Among some Christians there is the belief that people, no matter how bad, can be made to become good through education and reformation. The Quran, always unabashedly realistic, has a more satisfactory view, that guidance can only be had with God’s blessing, that even if someone fully understands God and believes in Him, they can still choose to be evil. The Quran goes beyond this, saying that once a person fully devolves into evil, not only will they become unreformable, but that God will actively prevent any reform, because they’ve done sufficient evil to seal their fate (as in the case of the Pharaoh of Egypt in the story of Moses).

If you could but see when they are made to stand before the Fire and will say, "Oh, would that we could be returned [to life on earth] and not deny the signs of our Lord and be among the believers."

But what they concealed before has [now] appeared to them. And even if they were returned, they would return to that which they were forbidden; and indeed, they are liars.

And they say, "There is none but our worldly life, and we will not be resurrected."

If you could but see when they will be made to stand before their Lord. He will say, "Is this not the truth?" They will say, "Yes, by our Lord." He will [then] say, "So taste the punishment because you used to disbelieve."

Truly, they have lost, those who deny the meeting with God , until when the Hour [of resurrection] comes upon them unexpectedly, they will say, "Oh, [how great is] our regret over what we neglected concerning it," while they bear their burdens on their backs. Unquestionably, evil is that which they bear.

And the worldly life is nothing but amusement and diversion; but the home of the Hereafter is best for those who fear God, so will you not reason?
[Quran 6:27-32]

The average person might be a sinner, but they do not fight against God every chance they get, and at the time of death they will likely possess enough light to be eligible for God’s forgiveness.

What are some examples of people who deserve eternal punishment? Usurers and their central bankers, who knowingly enslave millions to an evil, unnatural type of debt to enrich themselves, who orchestrate economic bubbles and bursts to reap trillions of dollars in profit while destroying the livelihoods of millions of families, and who plunge countries like the US into war after war, knowing that hundreds of thousands of innocent people will be killed, just so that they can earn their trillions financing these wars. A just God will not let these people go unpunished, and their punishment will not be something they can laugh at, it will not be a slap on the wrist like the US government gives to the usurers at Goldman Sachs every year when they are caught manipulating markets and destroying parts of the economy to enrich themselves. It will be something that will make them cry every single day for eternity.

I will not believe in a God who lets these people get away with the immense evil they do.

Conclusion

People make the mistake of considering this world their permanent home. They become attached to its blessings and disasters, and they think they can judge God based on what happens in their lives. But this world is nothing more than a tool for distinguishing God’s true friends from His fair-weather friends, and distinguishing these from His true enemies.

This world is nothing more than a preparation for the eternity of the afterlife. We would be wise not to become attached to its ups and downs, and to know that these are the days given to us by God in which we can prove ourselves to Him.

***

I originally published this essay as a short ebook on Amazon in 2015. I’ve decided to publish it for free here on my website, after thoroughly rewriting it, so that more people may (hopefully) benefit from it.

Why you should ditch Intel if you want a competitive PC market

Intel is famous for its various efforts to destroy AMD over the past 20 years, and it is so powerful and too-big-to-fail that legal action against it has never amounted to more than slaps on the wrist.

If you believe in the importance of ethics and morality in corporate actions, avoid Intel as a matter of principle. They don’t deserve your money. They deserve to die and to be forgotten. If you keep buying their stuff, you are telling them it is OK to keep on their evil and malicious practices, because they are being rewarded by you for it rather than being punished.

Here is the latest example of Intel being an example to us all:

Why the Banks are So Powerful and Why the Bible and the Quran Forbid Usury: Charting How Interest Creates Obscene Wealth Inequality

Imagine if in 1913 the real economy of the US had $100 billion in capital, while the banks and money-lenders had only $1 billion. Given everyday economic circumstances, by 2017, the wealth of the real economy would have grown to $2163 billion (with a 3% economic growth rate). Meanwhile, the wealth of the banks and money-lenders during the same period would have grown from $1 billion to $3806 billion. Starting at only 1% of the wealth of the real economy, within just over 100 years, the financial sector grows to 175% the size of the real economy.

This is the heart and soul of usury; the reason why banks are so powerful, and the reason why usurers have been hated with visceral hatred throughout history. The usury sector uses the law to enforce an alternate reality where their profits grow faster than the real economy. If they were honest investors, their money would be directly invested into the economy, so that their wealth would grow (and shrink) with the real economy. But through the hateful invention of usury, they create an alternate reality where their wealth always grows faster than the real economy.

The chart assumes a relatively low business loan interest rate of 5%, and a high delinquency rate of 6.75% (the highest recorded by the St. Louis Fed between 1987 and 2016), and a high (usurer-unfriendly) reserve ratio of 33% (the lower the reserve ratio, the faster the wealth of money-lenders grows, as they earn more interest on their capital).

Usury is evil because, on a macro scale, it passes off most risks to the borrower, and most profits to the lender. In the world of business, businesses sometimes make a profit, sometimes make a loss. But in the world of usury, usurers always make a profit. They lend money at 5% to a business and demand 5% profit after the year with complete disregard for whether the business profited or made a loss.

In this way, usury turns the whole economy into a casino where the usurers win most of the time. They happily lend money to everyone they can burden with debt then demand profits (interest) at a fixed rate without regard for the fact that in the real world people sometimes profit, sometimes make losses. The usurers live in a parallel reality where they always profit.

In this way, the wealth of usurers grows faster than the wealth of the rest of society, enabling them to slowly but surely take control of the whole economy by buying up its lands and businesses. Below is a chart of this process over 20 years in a small town, assuming both the money-lender and the townsfolk have $10 million at the beginning.

A wealthy usurer looks at a fellow human and thinks, “How can I turn this person into a profit-making tool for myself?” They want to give him $10,000 to take risks with, but they want to charge him 5% annual profit regardless of whether he profits or loses. In this way they drive a wedge through reality; most profits to the usurer, all losses to the borrower. They do not want to honestly invest their wealth (such as by starting businesses), because they may lose. Instead, they give their money to you so that you will lose if things go badly, while enjoying the power of the law in extracting their profits from you year after year regardless of your loss.

The usurers at the Federal Reserve, Wall Street and the Chicago School of Economics would have you believe that the above situation is unavoidable, that it is just a fact of life, and that if you dislike money-lenders for their profiteering and rent-seeking, you are just hating them for their wealth.

What is not mentioned is that there is a way for the wealthy to invest their wealth without creating wealth inequality and giving themselves such an obscene advantage over the population, and that method is simply honest investment, what I call Socratic Finance, as Socrates mentions it in Plato’s Republic. It is to make the lender and the borrower share in their fair portion of risk and gain.

How is this magic performed? By prohibiting the charging of interest. When the charging of interest is prohibited, money-lenders are made to invest in the real economy, and to share in its profits and losses. If the town’s money-lender cannot practice usury, and has $10 million in wealth compared to the town’s $10 million, he would be forced to spend his money investing in the real economy by buying businesses or starting new businesses, creating jobs in the process, and raising wages, as he has to compete with other business for available talent. In this way he shares in the town’s profits and losses, instead of enjoying a 5% guaranteed annual profit rate that has nothing to do with reality, that is just a legal fiction designed to enrich him at the expense of his borrowers.

If he wants to invest his money to finance housing, instead of using the corrupt practice of mortgaging, he would offer up houses on a rent-to-own basis. In a normal mortgage, a person is made to carry the burden of a $300,000 loan while the money-lender continues to own the house. In the case of default, the money-lender gets the house back, sells it, and if it sells for less than the outstanding loan amount, he goes after the borrower for the rest of the principal. Most mortgage defaults happen during times of financial crises, when people lose jobs, and when houses lose value. If the home was mortgaged at $300,000, during a crisis it would sell for only $200,000. If the buyer had paid $20,000 of the principal off, they would lose the house, and still owe $80,000 to the usurer.

But Socratic home financing is a world apart from this. If a person gets a Socratically-financed home, and then is unable to make payments, the investor gets the house back and sells it, and the home-buyer gets his principal share of the house back. If he had paid off 20% of the principal, he would get 20% of the house’s sale price. In a Socratically-financed home, the buyer always gets some money back in the case of default, as there is no loan involved, it is real ownership transfer of the house. In the previously mentioned case of the $300,000 house, the buyer would get $40,000 back after foreclosure, instead owing $80,000.

Over the past 400 years, most Christians have continued the tradition of being utter disgraces to the name of Christ, so that today even the Vatican funds its operations through usurious lending. Even the Amish practice usury.

If but a probable suspicion arose
of a man to occupy that filthy trade
He was taken for a devil in the likeness of a man.
But good Lord, how is the world changed?

That which infidels cannot abide, Gospellers allow,
That which Jews take only of strangers
and will not take of their countrymen for shame,
That do Christians take of their dear friends
and think for so doing they deserve great thanks.

Thomas Rogers (Anglican theologian, ca. 1555-1616)

Today’s usurers try to absolve themselves from their sins, and whitewash their actions, through the practice of philanthropy. Almost every wealthy usurer is described as a “philanthropist” on Wikipedia. They gain billions of dollars by squeezing the life out of the economies that play host to them, using usury to drive a wedge into the economy and extract rent from it, then spend a few hundred million dollars funding hospitals, museums and universities, and lo and behold! They are philanthropists. It is to this usurer trick of philanthropy that Rabbi Hermann Adler, Chief Rabbi of the British Empire from 1891 to 1911, refers when he says:

No amount of money given in charity, nothing but the abandonment of this hateful trade, can atone for this great sin against God, Israel and Humanity.

The Risk-Profit Differential

The evils of usury, and the immense urge that usurers feel to practice it, can all be summed up into one phrase: the risk-profit differential.

Whatever reasons usurers bring up to defend usury can be defeated by mentioning this phrase. The risk-profit differential is the core of usury, the reason why usurers prefer usury over productive investment, as was recognized by Jesus in his Parable of the Talents.

The risk-profit differential refers to the fact that, at its core, every usurious contract is about passing off more risk to the borrower than to the lender, and passing off more profit to the lender than to the borrower. This differential, this unbalanced arrangement that constantly pushes risk away from the usurer while also constantly pushing profit toward him, is where the attraction of usury lies.

It is the desire of every human to want to increase profits while also wanting to decrease risks. A usurer is simply someone selfish enough to create an arrangement that puts this unchecked, selfish animal desire into law through a contract that ensures him more profit and less risk, while also ensuring less profit and more risk to the borrower.

Usury is about enforcing a contract that enslaves the borrower to the usurer’s interests. The usurer class ensures itself a constant rate of profit (the class as a whole always profits, never loses), while the borrower class profits and loses randomly as economic conditions demand. The usurer class gets guaranteed profits. The borrower class is forced to share its profits with the usurers, while also being made to keep its losses to itself.

Through this unbalanced arrangement, the wealth of the usurer class balloons. They build skyscrapers to house their banks and insurance companies. The rest of society’s prosperity grows fast at first, then stagnates, and then starts to decline as the debt load grows, until a situation is reached, like that in the US, where bankers and their friends are the richest and most powerful people in the country, almost living in alternate reality, with lavish lifestyles and massive mansions subsidized by the interest payments of the millions of peasants.

Casinos make profits by having machines that win very slightly more often than they lose. Perhaps winning 52% of the time and losing 48% of the time. Usury, through the risk-profit differential, turns the entire economy into a casino where the usurers win 80% of the time, and lose 20% of the time (through defaults and bankruptcies). While a large casino makes a few billion dollars a year for its owners through its rigged nature, the economy, due to the rigged usury, makes trillions every year for the usurer class.

Usury is an unbalanced arrangement, otherwise it wouldn’t be usury. There is no way to make usury fair, to make it harmless, to make it add positive value to society. The only solution to usury is to ban it, as the English Kings Edward I and Edward VI did.

No matter how many clever arguments the usurers and their economists come up with in defense of their usury, they can never make this fact go away, as this is the only reason a usurer practices usury: he wants nearly all profits to come to himself, and nearly all losses to go to his borrowers. He wants to give his money to a peasant who is legally forced to share his profits with the usurer while bearing the full burden of any losses.

Debt slavery

The problem with usury is that the profits of lenders always grows faster than the profits of borrowers. When you borrow $10,000 at 5% interest, within this transaction is the embedded assumption that your prosperity will grow by at least 5% in the next year. This is why Aristotle and many other philosophers and intellectuals call usury “unnatural.” The profits of usury are separate from the profits of the actual economy in which it exists. When usurers lend at 5%, they are maintaining a parallel alternate reality in which the economy profits at 5% in the next year, regardless of whether the actual economy profits at 5% or not.

While some borrowers make good use of the money they have borrowed and make more than 5%, so that they can pay off the usurers and still make a profit, others, because of the millions of chances that operate in the reality of an economy, make a loss on the money they have borrowed. They may have borrowed $10,000, and a year later they only have $8,000 left, because their business dealing didn’t work out as they expected. But the usurer, in his alternate reality, continues to pretend not only that the $10,000 still exists, but that the $10,000 made a 5% profit. He collects $500 from the borrower at the end of the year, leaving the borrower with $7500 in cash, and a $10,000 debt to pay off. If the borrower continues to be unlucky the next year, he loses another $2,000 of his cash, but he still has to pay about $500 to the usurer, so now he has $5,000 left in cash, and a $10,000 debt to pay off.

Meanwhile, during these two years, the usurer has earned $1,000 in profit, without losing any of the $10,000 he gave to the borrower, since the borrower is required to pay it back regardless of his or her profits or losses.

Usury is a way of earning money by the virtue of having money, while making others carry the burden of any risk that comes out of using the money. It is an amazing deal—for the usurer. For the borrower, sometimes it is a good deal, sometimes it breaks even, and sometimes it is pure slavery.

A modern, poignant form of debt slavery today is student debt. A usurer lends a student $100,000 at, let’s say, 5% interest. Within this debt is the assumption that not only will the student be able to use their $100,000 degree to earn that much back over their career, but that they will also make a 5% profit, every year, over and above the cost of the degree.

As it happens, some students graduate and succeed in the business world, so that they pay off the loan in 10 or 15 years while enjoying a good, or at least an acceptable, standard of living.

But for many students, this is only something that they can dream of. They borrow tens of thousands of dollars, only to spend the rest of their lives barely being able to make the monthly payments on their loans. And ten years after graduation, due to changing economic, political or technological conditions, their degrees may be completely worthless, meaning that they racked up $100,000 or more in debt for something completely useless. This $100,000 will hover over them like a dark cloud for the rest of their lives.

Meanwhile, the usurer in his or her high tower, continues to extract a 5% interest, or $10,000 a year, from the student, with the law enabling them to maintain an alternate reality in which that completely useless degree is actually worth $100,000, and also that that useless degree is enabling the student to earn a 5% yearly profit over the value of the degree.

In 2015, there were 2.8 million Americans over the age of 60 who were still living with student debt. US law, authored by usurers and their lobbyists, prohibits these people from declaring bankruptcy so that they can get rid of this cloud that has been giving them constant stress since their early adulthood. The law forces them to pay it off, and empowers usurers to seize these people’s wages and properties to get not only the original $100,000, but an additional $10,000 yearly profit over and above that for every year these people have had their debt, which, for a person of 60, means for their entire adult lives. Student debt has turned these people into money-making machines for the usurers.

Usury is about creating an alternate reality in which the economy profits at 5%, or 20%, or whatever the usurers are currently lending their money at, and using the law to force this reality on the population, regardless of the actual economy.

In the real economy, each year and each month’s profits are different from the previous ones’. One year the economy may make a 5% profit, another a 2.5% profit. A war may break out, or natural disaster may strike, causing the economy to make a loss. Political conditions can change. Trade wars, currency speculation and terrorism can severely damage an economy’s profits.

But in the blissful alternate reality of the usurer, none of this happens. Each year is full of sunshine and great harvests, and the population will have to subsidize this alternate reality for them.

Forecasting the World’s Top 50 Most Powerful Countries in 2035 Using the HQI

The following table is a list of 50 countries that are predicted to have the most economic, technological and military power in the world by the year 2035, according to HQI theory. The projected power of the United States is set to 100 to make it easy to compare other countries with it. China’s projected power is 251.6, meaning it will be more than double as powerful as the United States in 2035.

The 2035 populations are projected based on the average of a linear regression of population growth rates between 1995 and 2015. If a country’s population growth rate was 3% in 1995 and 2% 2015, it is assumed that in 2035 the population growth rate will be 1%. The average of the 2015 and 2035 growth rate is taken (1.5%), and this is recursively applied 20 times to arrive at the 2035 population. This is somewhat crude but good enough for our purposes.

The HQI is the Human Genetic-Cultural Quality Index, a measure of a population’s capacity for intellectual achievement and technological innovation, by taking into account a country’s scientific output and real (Smithian) economic growth. China’s HQI is 856 while the HQI of the United States is 1372, meaning each Chinese citizen adds a relative value of 856 to China’s economy, while each American citizen adds a value of 1372. The HQI indicates the “quality” (as opposed to quantity) of the human capital of a country.

By multiplying a population’s count by its HQI, we arrive at a number that indicates the total power for innovation in the population as a whole. In 2035, India will have more people than China (1.52 billion versus 1.46 billion), but since China’s HQI is higher (i.e. since its population is of higher genetic-cultural quality), its power and might will be consequently larger. In fact, China will be five times more powerful than India in 2035, and 2.5 times more powerful than the United States. It will be the most powerful country in the world by a wide margin.

Iran gets an advantage over Russia due to its higher economic growth, fast growing population, and its higher scientific output per capita (25% higher than that of Russia). However, many of Russia’s recent troubles have been due to economic warfare from Wall Street, therefore it is highly unlikely that it will ever be less powerful than Iran. As the HQI is updated over the next few years, Russia’s numbers should improve significantly.

Qatar and Saudi’s high HQI numbers are largely due to their importation of foreign scientists to carry out research in their universities and are not indicative of native capabilities.

It is unlikely that Germany will be less powerful than the United Kingdom in 2035. The HQI of the UK is inflated by the UK’s higher output in the “soft” sciences. Germany actually outdoes the UK in many important scientific fields, such as energy, engineering, physics, astronomy, mathematics and chemical engineering. The UK is superior in medical research.

South Korea produces far more science per capita than Japan, and its economy is growing fast. Both of these factors go toward its much higher HQI compared to Japan (1627 vs. 605). South Korea’s actual advantage may be smaller, and it seems unlikely that it will actually be more powerful than Japan.

How it Works

A country’s HQI shows its potential for growth. It says that after decades of infrastructure-building, urbanization and everything else that goes into producing a developed economy, that country can reach the level of output and innovation that another, fully developed nation of similar HQI has. What this means is that multiplying a non-fully-developed nation’s HQI will give us a number that reflects its power in a few decades, when it has finished developing.

The Chinese population’s HQI of 856 is close to that of Italy’s (945). What this means is that 20 years from now, once China has fully developed, it will have the same economic, military and technological power of an imaginary Italy that has 1.46 billion people. This thought alone should be sufficient to keep those Americans awake at night who think they will forever be the world’s biggest power. Can an America with 364 million people stand up to an Italy with 1.46 billion people? Italy’s 60 million people published 106000 scientific papers in 2015. If that population grows to 1.46 billion, an increase by a factor 24, that means they would likely be able to publish 2.5 million scientific papers per year, dwarfing America’s scientific output of 600,000 papers per year, and with that, dwarfing America’s ability at innovation and technological progress, and its economic and ultimately military power.

That imaginary Italy is very much what China is going to be in 20 years. The HQI of Italy and China are similar. All that remains for China to do to become an Italy with 1.46 billion people is to finish building its economic and scientific infrastructure, and this will probably be done in the 20 years, as the example of South Korea’s development shows.

As for already developed nations, their HQI can be multiplied by the present population to get its present level of power, and it can be multiplied by its projected future population to get its future power. This only makes sense for developed nations. For developing nations like China (and South Korea until recently), the population is high quality, but everything else isn’t, therefore the population is being held back by various factors from achieving what their HQI suggests. For this reason we give these fast-developing nations 20 years to reach their full potential.

Country Projected 2035 Population HQI Relative Economic, Technological and Military Power in 2035
1 China 1,464,562,493 856 250.46
2 United States 364,631,940 1372 100.00
3 India 1,520,438,646 162 49.24
4 United Kingdom 79,223,389 1818 28.79
5 Germany 93,984,408 1218 22.88
6 Australia 31,623,131 3561 22.51
7 France 72,157,368 1165 16.80
8 South Korea 50,400,996 1627 16.39
9 Canada 42,699,016 1859 15.87
10 Brazil 225,917,248 332 14.99
11 Japan 117,049,007 605 14.15
12 Iran 100,194,389 626 12.53
13 Italy 61,510,122 945 11.62
14 Spain 44,357,325 1277 11.33
15 Turkey 101,374,566 479 9.70
16 Russian Federation 149,971,486 312 9.35
17 Switzerland 10,987,401 3910 8.59
18 Poland 37,352,026 1120 8.37
19 Netherlands 18,189,750 2238 8.14
20 Taiwan 22,039,541 1717 7.56
21 Sweden 12,588,464 2775 6.98
22 Saudi Arabia 43,095,570 768 6.61
23 Nigeria 312,375,890 97 6.05
24 Singapore 5,924,284 4823 5.71
25 Malaysia 36,376,961 756 5.50
26 Israel 10,953,808 2410 5.28
27 Egypt 132,313,330 198 5.23
28 Belgium 12,642,382 2058 5.20
29 South Africa 70,569,040 292 4.12
30 Iraq 68,203,001 295 4.03
31 Norway 6,858,738 2925 4.01
32 Austria 10,735,422 1859 3.99
33 Czech Republic 11,684,419 1569 3.66
34 Pakistan 272,264,022 66 3.59
35 Denmark 6,374,946 2812 3.58
36 Mexico 152,508,904 110 3.37
37 New Zealand 6,972,004 2352 3.28
38 Hong Kong 7,811,688 1997 3.12
39 Qatar 4,879,996 2815 2.75
40 Argentina 50,278,252 253 2.54
41 Finland 5,873,345 2034 2.39
42 Portugal 8,783,800 1359 2.39
43 Thailand 68,077,965 174 2.37
44 Chile 21,146,173 535 2.26
45 Ireland 5,233,086 1959 2.05
46 Indonesia 314,805,429 29 1.84
47 Romania 19,228,586 475 1.83
48 Colombia 55,052,245 163 1.80
49 Greece 8,774,644 934 1.64
50 Algeria 58,570,388 129 1.51

Please see my essays on the HQI and the 12-Year Min-Max Average for the fine print regarding how the above numbers were calculated. Most of the data is from the World Bank. Taiwan’s population growth rate was taken from Worldometers.com as it is missing from the World Bank data.

Below is the same table with the nitty-gritty details exposed, and with seven bonus countries at the end. Download it as an Excel file or PDF.

Country 2015 Citable Scientific Documents 2015 Population 1995 Population Growth Rate 2015 Population Growth Rate 2035 Projected Population Growth Rate Projected Annual Population Growth Rate (Mean of 2015 & 2035 Rates) Projected 2035 Population Average Real Annual Economic Growth (2004-2015) [12-Year Min-Max Method] HQI Relative Power in 2035
1 China 416,409 1,401,586,609 1.1 0.5 -0.1 0.2 1,464,562,493 10.5 856 250.46
2 United States 567,007 325,127,634 1.2 0.8 0.4 0.6 364,631,940 0.5 1372 100.00
3 India 123,206 1,282,390,303 1.9 1.2 0.5 0.9 1,520,438,646 7.1 162 49.24
4 United Kingdom 169,483 63,843,856 0.3 0.8 1.4 1.1 79,223,389 -0.6 1818 28.79
5 Germany 149,773 82,562,004 0.3 0.5 0.8 0.7 93,984,408 -0.8 1218 22.88
6 Australia 82,567 23,923,101 1.2 1.3 1.5 1.4 31,623,131 3.0 3561 22.51
7 France 103,733 64,982,894 0.4 0.5 0.6 0.5 72,157,368 -0.1 1165 16.80
8 South Korea 73,433 49,750,234 1.0 0.4 -0.3 0.1 50,400,996 3.6 1627 16.39
9 Canada 89,312 35,871,283 0.8 0.9 0.9 0.9 42,699,016 0.1 1859 15.87
10 Brazil 61,122 203,657,210 1.5 0.9 0.2 0.5 225,917,248 3.7 332 14.99
11 Japan 109,305 126,818,019 0.4 -0.1 -0.7 -0.4 117,049,007 -0.4 605 14.15
12 Iran 39,727 79,476,308 1.4 1.2 1.1 1.2 100,194,389 5.0 626 12.53
13 Italy 95,836 61,142,221 0.0 0.0 0.0 0.0 61,510,122 -1.7 945 11.62
14 Spain 79,209 47,199,069 0.2 -0.1 -0.5 -0.3 44,357,325 0.3 1277 11.33
15 Turkey 39,275 76,690,509 1.6 1.5 1.4 1.4 101,374,566 2.3 479 9.70
16 Russian Federation 57,881 142,098,141 0.0 0.2 0.4 0.3 149,971,486 0.4 312 9.35
17 Switzerland 39,358 8,238,610 0.7 1.2 1.7 1.5 10,987,401 1.0 3910 8.59
18 Poland 37,285 38,221,584 0.1 0.0 -0.2 -0.1 37,352,026 4.2 1120 8.37
19 Netherlands 51,434 16,844,195 0.5 0.4 0.4 0.4 18,189,750 0.0 2238 8.14
20 Taiwan 34,011 23,381,038 0.8 0.1 -0.7 -0.3 22,039,541 4.5 1717 7.56
21 Sweden 35,039 9,693,883 0.5 1.1 1.6 1.3 12,588,464 0.4 2775 6.98
22 Saudi Arabia 17,529 29,897,741 2.6 2.1 1.6 1.8 43,095,570 5.9 768 6.61
23 Nigeria 5,112 183,523,432 2.5 2.6 2.8 2.7 312,375,890 18.2 97 6.05
24 Singapore 17,976 5,618,866 3.0 1.2 -0.7 0.3 5,924,284 7.3 4823 5.71
25 Malaysia 23,414 30,651,176 2.5 1.4 0.3 0.9 36,376,961 3.0 756 5.50
26 Israel 18,040 7,919,528 2.7 2.0 1.3 1.6 10,953,808 3.7 2410 5.28
27 Egypt 14,800 84,705,681 1.9 2.1 2.4 2.3 132,313,330 4.5 198 5.23
28 Belgium 29,180 11,183,411 0.2 0.5 0.8 0.6 12,642,382 0.7 2058 5.20
29 South Africa 17,409 53,491,333 2.2 1.7 1.1 1.4 70,569,040 2.0 292 4.12
30 Iraq 1,793 35,766,702 3.1 3.2 3.4 3.3 68,203,001 27.8 295 4.03
31 Norway 18,228 5,142,842 0.5 1.1 1.8 1.5 6,858,738 1.2 2925 4.01
32 Austria 21,818 8,557,761 0.2 0.8 1.5 1.1 10,735,422 -0.1 1859 3.99
33 Czech Republic 20,759 10,777,060 -0.1 0.3 0.6 0.4 11,684,419 1.0 1569 3.66
34 Pakistan 10,962 188,144,040 2.5 2.1 1.7 1.9 272,264,022 4.6 66 3.59
35 Denmark 23,081 5,661,723 0.5 0.6 0.6 0.6 6,374,946 -0.6 2812 3.58
36 Mexico 18,417 125,235,587 1.9 1.3 0.7 1.0 152,508,904 0.2 110 3.37
37 New Zealand 13,052 4,596,396 1.5 1.9 2.3 2.1 6,972,004 1.3 2352 3.28
38 Hong Kong 14,710 7,313,557 2.0 0.9 -0.2 0.3 7,811,688 3.1 1997 3.12
39 Qatar 2,766 2,350,549 1.2 2.9 4.6 3.7 4,879,996 14.9 2815 2.75
40 Argentina 11,815 42,154,914 1.3 1.0 0.8 0.9 50,278,252 2.2 253 2.54
41 Finland 17,551 5,460,592 0.4 0.4 0.4 0.4 5,873,345 -1.5 2034 2.39
42 Portugal 21,159 10,610,014 0.4 -0.5 -1.4 -0.9 8,783,800 -0.8 1359 2.39
43 Thailand 11,632 67,400,746 0.9 0.3 -0.2 0.1 68,077,965 3.4 174 2.37
44 Chile 10,347 17,924,062 1.5 1.0 0.6 0.8 21,146,173 2.5 535 2.26
45 Ireland 11,370 4,726,856 0.5 0.5 0.5 0.5 5,233,086 1.1 1959 2.05
46 Indonesia 6,280 255,708,785 1.5 1.2 0.9 1.0 314,805,429 5.5 29 1.84
47 Romania 13,053 21,579,201 0.0 -0.4 -0.8 -0.6 19,228,586 0.7 475 1.83
48 Colombia 7,500 49,529,208 1.7 0.9 0.2 0.5 55,052,245 4.3 163 1.80
49 Greece 16,616 11,125,833 0.5 -0.6 -1.7 -1.2 8,774,644 -1.7 934 1.64
50 Algeria 5,171 40,633,464 1.9 1.9 1.8 1.8 58,570,388 3.8 129 1.51
51 Serbia 6,540 9,424,030 -1.4 -0.5 0.5 0.0 9,490,218 3.0 663 1.26
52 Tunisia 6,228 11,235,248 1.9 1.0 0.1 0.5 12,525,418 2.2 493 1.23
53 Hungary 9,478 9,911,396 -0.1 -0.2 -0.3 -0.3 9,408,537 -0.8 653 1.23
54 Viet Nam 4,092 93,386,630 1.6 1.1 0.5 0.8 109,194,988 6.4 55 1.20
55 Slovakia 6,271 5,457,889 0.3 0.1 -0.1 0.0 5,463,349 2.7 1068 1.17
56 Morocco 4,079 33,955,157 1.5 1.3 1.1 1.2 43,445,867 5.0 134 1.16
57 Ukraine 8,868 44,646,131 -0.8 -0.4 0.1 -0.1 43,369,074 -1.4 129 1.12


Measuring Economic and Military Potentials of World Nations with the Human Genetic-Cultural Quality Index (HQI)

Introduction

What is the biggest predictor of a country’s scientific output, industrial capacity and military prowess? It is not geographic size. For instance, Kazakhstan and Mongolia are huge compared to Israel and Switzerland, yet Israel and Switzerland far outdistance them in all measures of intellectual, technological and military attainment.

It is not population. India’s 1.28 billion people are close in number to China’s 1.4 billion. And India has been a West-connected capitalist country since its independence in 1947, while China only started in the 1980’s. Yet China far outstrips India in all measures of technological and military power.

It is not natural resources. Russia has vastly more natural resources than Germany. Yet Germany’s economy is many times that of Russia, and its scientific output is double that of Russia, even though Russia’s population is close to double that of Germany.

The most important predictor of a country’s power and accomplishment is the nature of its population. A country’s most precious natural resource is its citizens. It is the genetic makeup of a population, enabled by supportive cultures, institutions and infrastructure, that predicts the country’s military-industrial power and capacity for innovation.

The book IQ and the Wealth of Nations by the professors Richard Lynn and Tatu Vanhanen makes a powerful argument for the importance of IQ in predicting a country’s power and prosperity, with IQ being a highly heritable (genetically-mediated) trait. While some of the data they use is not reliable, the general force of their argument is undeniable. The data used by Adam Smith and Charles Darwin were none too reliable either, but that didn’t stop their theories from being world-class accomplishments.

IQ is not everything. Japan’s IQ is in the same league as Germany and Sweden. Yet Swedes produce four times more science per citizen than the Japanese (measured in scientific papers published in peer-reviewed journals). Germans produce double the amount of science per citizen than the Japanese. An argument can be made that Japan’s infrastructure has yet to catch up with that of Western Europe. But Japan has had more than enough time (seven decades, in fact) to catch up. And a look at Japan’s infrastructure shows that they might even be ahead of Western Europe when it comes to infrastructure.

The factors that lead to Japan’s low accomplishment relative to Western Europe could be other genetic factors not widely studied. One factor could be Japan’s low testosterone levels compared to Europe, with testosterone being a significant contributor toward the drive for accomplishment1. Another factor could be aging. An aging population is going to be less productive than a younger one. Another factor could be non-genetic; for example cultural practices and ideals, although these factors are not independent of genetics and should be considered together with genetics2.

The Human Genetic-Cultural Quality Index

The HQI, short for the Human Genetic-Cultural Quality Index, takes account of both genetic and cultural factors to accurately predict a country’s real scientific, economic and military potential. It is a measure of the quality of human capital, a nation’s most important natural resource, and provides a single number that can be used to compare the quality of the human capital of different nations.

The math of the HQI will be explained below. For now, I will offer certain examples from it to illustrate the concept. Ukraine has an HQI of 129, while Russia’s HQI is 311. This means that a Russian citizen adds 2.6 times more value to Russia’s economy and scientific output than a Ukrainian citizen adds to Ukraine’s economy and scientific output. The quality of Russia’s human capital is 2.4 times that of Ukraine’s human capital. Even if Russia and Ukraine had exactly the same population (let’s say each had a population of 150 million), Russia would still be 2.4 times as powerful as Ukraine. Today, Russia’s population is 3.15 times as large as Ukraine’s (143.5 million vs. 45.49 million). Multiplying this by the 2.4 times HQI advantage, we arrive at a factor of 7.59. Russia is, or will be, 7.59 times as powerful as Ukraine when both countries reach their near-full development potential, perhaps in the next 30 years.

China’s HQI is 855. India’s is 162. Even if both countries had the same population, China would still be 5.2 times as powerful as India once both countries reach their near-full development potential.

The HQI uses two data points as predicting variables:

  1. Scientific papers per capita, which refers to the number of scientific papers published in a year by the nation, divided by its population. This measures the intellectual capacity of the nation’s population.
  2. Real economic growth rate. When a nation’s economy is growing fast (such as that of China), it shows that the nation’s institutions and infrastructure haven’t reached their full potential. The economic growth rate is used to correct for this fact. For instance, China’s papers per capita is only three times that of India’s. But China’s real 12-year average annual economic growth rate is 10.5%, while India’s is 7%. This means that the economic and scientific potential of China’s human capital has significantly more room to grow than India’s, as will be further illustrated down below.

The (real) economic growth rate of a nation expresses elasticity of human potential for a given nation. If growth is faster, improvements in infrastructure and institutions lead to big gains in the human potential of the nation, i.e. that the human potential of the nation is being held back by infrastructure and institutions, and that as these improve, so will the output of the nation’s human capital.

A slow economic growth rate indicates one of two things:

  1. The nation has reached close to its full potential, so that its human capital is already working at its full capacity. This is the case with slow-growing developed nations like Japan and the Netherlands.
  2. The quality of the nation’s human capital is so low that while theoretically there is much room for growth given the nation’s circumstances, that growth is being held back by human capital that’s not capable of achieving it. This is true in the case of various African and Latin American countries that have everything they could possibly need for growth, except a population that’s actually capable of said growth.

The history of colonization shows the importance of the genetic and cultural factors that go into the HQI. Any nation that becomes colonized by a high HQI population will quickly grow to reflect the home population’s intellectual prowess rather than the native population’s destitution. This has been true in the United States, Australia, Argentina, New Zealand and South Africa.

The most recent example comes from Israel. When Israel was colonized by Ashkenazi Jews that had been selected for high IQ in Europe during their 2000 year stay there3, Israel’s economy quickly grew to reflect a developed European nation, rather than a typical Middle Eastern one. It grew even above Eastern European nations, though it doesn’t seem likely it can surpass Germanic nations, as it has already had all the time and help it needs to achieve this.

The Mathematical Model

For any given nation and year, this is how the HQI basis number is calculated:
With a being the number of peer-reviewed scientific journal articles published in the year, b being the 12-year min-max average of economic growth4 for that year and the preceding 11 years, and c being the population of the nation in that year.

China published 416,409 peer-reviewed scientific journal papers in 2015. Its annual economic growth rate was 10.545 for the period 2004-2015 inclusive. And its population in 2015 was 1,401,586,609 (1.4 billion). The equation to calculate the HQI basis number thus becomes:

This results in a number of 0.001162729158. Since this is not a user-friendly number, the numbers for all nations are all multiplied by the arbitrary value of 735853.761, which gives an HQI of 1 to the lowest HQI country. This provides an easy-to-follow ground to which other countries can be compared. China’s HQI thus becomes 855.59. This means that a Chinese citizen adds a value to China’s economy that is 855.59 times greater than the value added by a citizen of the lowest HQI country to their respective economy (which happens to be the Democratic Republic of the Congo).

Raising the number of a country’s scientific papers to a power of (1 + its economic growth rate) is a mathematical trick that models both of these scenarios:

  1. Scientific output growth that continues at the rate of the country’s past 12-year economic growth rate for the next 11 years.
  2. Scientific output growth that starts off at the country’s average past 12-year economic growth, and then slows down by 6.95% every year over the next 30 years.

The assumption here is that a country’s scientific output will continue growing at the rate of the country’s economic growth over its past 12 years. This may seem a strange assumption, since a country’s future growth cannot be assumed to follow at the same rate as its past growth.

In fact, the correct assumption is that its economic growth will be quite lower. But what we are modeling here is not economic growth, it is growth in scientific output, whose future growth follows along the lines of a country’s past economic growth.

An example will make this clear. South Korea’s GDP grew from $771 billion USD in 2004 to $1.14 trillion in 2015 (all in 2000 dollars), a growth of about 48%. During the same period, its scientific output rose from 31182 papers in 2004 to 69469 papers in 2015, a growth of 122%, more than double its economic growth.

The growth in South Korea’s scientific output from 2004 to 2015 is actually similar to its GDP growth from 1989 to 2003 ($332 billion to $735 billion, a growth of 122%).

In short, scientific output is a lagging indicator of a country’s development, due to the amount of past investment necessary for its growth. No matter how much a country invests into increasing its scientific output, the tangible fruits of said investment will be over a decade in the future. The exception being countries like Saudi Arabia who rapidly increased their scientific output by importing foreign scientists.

India’s scientific output grew from 33031 papers in 2004 to 113144 papers in 2015, a growth of 242%. During the same period, its inflation-adjusted GDP grew from $0.971 trillion to $2.03 trillion, a growth of 109%. The growth in its scientific output was more than double the growth in its economic output.

Its growth, in fact, was similar to its GDP growth from 1981 to 2003. The reason for its slow economic growth over this period may have been its low-effectiveness gene-culture (low IQ, etc.), and its low urbanization rate accompanied by its vast size, that meant it took far longer than South Korea to build the infrastructure and institutions necessary to support effective scientific research.

This phenomenon of scientific growth growing far faster than economic growth can be seen throughout the world. Needless to say, a more rigorous study of the relationship between scientific output and past economic growth can be done. But we can take it as a general rule that past economic growth predicts future scientific output growth.

China’s Coming Supremacy

Raising China’s 2015 scientific paper count of 416409 to a power of 1.105 (1 + its annual economic output growth over 2004-2015) results in 1620204, or 1.62 million. What this means is that once China reaches close to its full economic potential (perhaps after 2030), it will be producing about 1.62 million scientific papers every year. Compare this to the 567000 scientific papers published by the United States in 2015, which, according to the same HQI calculation, will grow to 606000 during the same period. In other words, in the next 20 or more years, China’s scientific output will be 2.67 times as large as that of the United States.

While this may sound controversial to someone who has been wooed by the nascent racism of neocons, globalists and central bank usurer economists in their propagandizing the idea that the US can somehow maintain a permanent technological edge over China, that despite China’s enormous growth and a scientific output that is closely approaching that of the United States, that there is something wrong with the Chinese that will forever keep them as second-class citizens on the world stage, to someone who understands the history of Japan and South Korea’s growth, and who understands the realities of the gene-culture, this conclusion of China’s approaching supremacy is merely stating the obvious.

Using the HQI for Comparative Study of Gene-Cultures and National Potentials

Below is a list of the world’s highest HQI nations (the full list is at the end), for the reader’s viewing pleasure, and to help you follow along the rest of the essay.

Rank Country 2015 Citable Scientific Documents 2015 Population Average Real Annual Economic Growth (2004-2015) [12-Year Min-Max Method] HQI Predicted Scientific Output at Near-Full Potential (2035 and After)
1 Singapore 17,976 5,618,866 7.32 4823 36,824
2 Switzerland 39,358 8,238,610 1.01 3910 43,774
3 Australia 82,567 23,923,101 2.99 3561 115,764
4 Iceland 1,365 336,728 2.41 3549 1,624
5 Norway 18,228 5,142,842 1.17 2925 20,445
6 Qatar 2,766 2,350,549 14.88 2815 8,991
7 Denmark 23,081 5,661,723 -0.65 2812 21,633
8 Sweden 35,039 9,693,883 0.41 2775 36,556
9 Monaco 129 38,320 1.64 2683 140
10 Luxembourg 1,692 543,261 1.51 2564 1,893
11 Israel 18,040 7,919,528 3.71 2410 25,938
12 New Zealand 13,052 4,596,396 1.25 2352 14,693
13 Netherlands 51,434 16,844,195 -0.03 2238 51,239

While the Qatari population have a higher IQ, and are more liberal, than most other Arab populations (perhaps with the exception of Lebanese Christians), their high HQI is strongly a result of their importation of foreign scientists on the one hand, and their fast growing oil revenue on the other, the latter funding the former.

Germanic nations have the highest HQI in the world. Switzerland and Iceland, with their relatively low immigration rates, show the high productivity of Germanic genes and cultures. Australia, Denmark, Norway, Sweden, New Zealand and the Netherlands, with their Germanic roots, follow along the same lines.

The table shows how the HQI can be used to compare the genetic-cultural quality of any two countries. Iceland’s HQI of 3548, divided by the 2238 HQI of the Netherlands, results in a 58% advantage for the Icelandic people. Icelandic people are 58% more capable and productive than Netherlanders, and if the two countries had the same population, Iceland would be 58% more powerful militarily, technologically and economically.

Israel’s high HQI is influenced by its high economic growth, a large portion of which comes from its cozy relationship with the United States (US intelligence agencies, for example, are reliant on many Israeli technology companies). It’s highly unlikely that its population is more capable than that of the Netherlands or New Zealand. This shows that the HQI is not immune to aberrations, similar to all other methods, as reality is full of aberrations caused by disasters, sanctions, wars and political changes.

But regarding Israel, the HQI shows one very important result: Israel is already close to its full scientific potential. Over the next 30 years or so, its scientific output can grow from 18040 papers to 21631. No great improvement can be expected from Israel, and given its precarious political situation, even this much growth may not be possible, though stranger things have happened.

Changes in HQI Reflect Fundamental Genetic-Cultural Changes in a Nation

Far more interesting than a country’s economic growth is HQI growth. The HQI itself is a measure of growth potential, HQI growth means growth in the growth potential. When a nation climbs toward a peak in achievement, economic growth refers to this climb. HQI growth refers to an increase in the height of the peak, a removal of constraints that prevent a nation from reaching the heights reached by other nations.

China’s 2015 HQI was 6.4% lower than its 2010 HQI. This means that between 2010 and 2015, there were some forces in effect that reduced China’s genetic-cultural fitness, or economic fitness, so that while it continued to grow fast, its predicted near-full potential decreased. This was mostly caused by a large drop in the number of scientific papers published by China in 2015. I have contacted SCImago to find out whether this change was due to changes in their paper counting methodologies or whether it was due to a real drop in China’s output. If it was a real drop, maybe it was due to China’s best and brightest aging and retiring, or due to growing practice of usury creating a Western European-style of stagnation faster than expected, or due to some unknown dysgenic effect.

From 2010 to 2015, Ethiopia’s HQI increased by 173%. This is a very, very good sign. It means that there are genetic-cultural changes that are improving the nation’s future potential, or that there are bottlenecks that are being overcome. Not only is the nation climbing toward the peak, the peak itself is growing. Perhaps it is due to improvements in nutrition and health care, or beneficial cultural changes, or both. The actual beneficial change is probably smaller.

Poland has been Europe’s favorite backwater since at least Adam Smith’s time. What does the HQI tell us about what is going on in there? From 2010 to 2015, Poland’s HQI increased by 21.9%. There are forces at work in Poland that are increasing its population’s genetic-cultural fitness, so that whatever we believed Poland’s maximum growth potential to have been in 2010, in 2015 that maximum growth potential was 21.9% higher.

The HQI of the United States decreased by 12.3% from 2010 to 2015. This means that there are forces at work reducing the genetic-cultural fitness of America’s average citizen. One simple explanation could be the increase in immigration from lower HQI nations, who increase the population of the US without significantly increasing its economic and scientific output. Keeping population constant, the HQI still decreased by 8.9%, therefore immigration might be only causing a 3.4 percentage points of this dysgenesis.

Germany’s HQI increased by 0.2% from 2010 to 2015, meaning that no interesting structural change happened. These numbers are from before the recent migrant crisis, whose presence is sure to bring down Germany’s HQI.

Japan’s HQI fell 15.7% from 2010 to 2015. Not only is the nation coming down the peak (through its negative economic growth), the nation’s peak is also decaying.

Russia’s HQI increased by 31.1% from 2010 to 2015. Even though its economic growth was low (0.36%), its scientific output greatly increased during this period, from 38878 papers to 55500. Russia’s seeming low GDP growth is largely due to economic warfare from Wall Street. Its scientific growth shows its true economic fitness.

Why Scientific Output is Important

The HQI uses scientific output as the most important indicator of a nation’s genetic-cultural fitness. There are many good reasons for this, the two most important being:

  1. Producing science requires that a nation be prosperous enough to afford having a class of society who dedicate most of their time to research. And that prosperity can only come from high genetic-cultural fitness for most countries, excepting a few oil states that can afford to import scientists.
  2. Producing science requires very high intellectual capacity and drive for accomplishment (perhaps most importantly IQ and testosterone). If a nation’s population is incapable of producing science, they will be equally incapable of producing high-tech military equipment and industrial innovation, necessary for a nation to increase its power.

A nation’s scientific output is a very good indicator of its fitness. If a nation’s economy is growing fast, by raising the scientific output to the power of its real economic growth, the HQI gives the nation a fair chance at proving itself. China’s scientific output per capita is quite low compared to that of the United States. But its real economic growth is much higher. We can safely assume that China’s per capita scientific output is going to grow at a rate similar to its past economic growth.

The Bottleneck Effect in the Growth of Scientific Output

India’s example shows that there might be a bottleneck effect in the growth of scientific output in large and highly undeveloped nations. As mentioned, India’s scientific output grew by 242% from 2004 to 2015, similar to its economic growth from 1981 to 2003. 12 years of scientific output growth were equal to 23 years of past economic growth. While in the case of South Korea, its 2004 to 2015 scientific growth was roughly similar to its economic growth of the 12 years preceding that.

India may have already overcome the bottleneck. Indonesia, Bangladesh, Pakistan, Nigeria, the Philippines and Vietnam probably haven’t yet, and this probably partly accounts for their low HQI’s.

For a large, undeveloped and already low-HQI nation (low IQ, bad law enforcement, etc.), building the prosperity and infrastructure necessary for doing science takes far longer than it takes a smaller and higher HQI nation. Decades of education, infrastructure building and perhaps most importantly, urbanization, are needed before a country’s scientific output momentum gets going.

List of 203 Sovereign States by Human Potential

Below is a table of 203 sovereign states sorted by HQI, from highest HQI to lowest. Note that the HQI number shows the genetic-cultural quality of each individual citizen within that nation, not the nation’s power. While each additional Singaporean citizen adds a value of 4822 to the economy of Singapore, each additional US citizen adds a value of 1372. Since the genetic-cultural quality of Singaporeans is so much higher than the genetic-cultural quality of US citizens, what the HQI shows is that if Singapore had the same number of citizens as the United States, it would 3.5 times as powerful as the United States, as each individual citizen adds so much more to its power and productivity. Singapore’s real superiority is probably lower, as it is mostly its fast economic growth, aided by its geo-political situation, that’s contributing to its high HQI.

The HQI for certain nations, such as Indonesia and North Korea, are clearly inaccurate due to their exclusion from the world’s scientific community. The HQI of Indonesia and many former Central Asian Soviet states should increase considerably as they start to adopt Western scientific practices.

Please see below the table for the fine print regarding the numbers.

Rank Country 2015 Citable Scientific Documents 2015 Population Average Real Annual Economic Growth (2004-2015) [12-Year Min-Max Method] HQI
1 Singapore 17,976 5,618,866 7.32 4823
2 Switzerland 39,358 8,238,610 1.01 3910
3 Australia 82,567 23,923,101 2.99 3561
4 Iceland 1,365 336,728 2.41 3549
5 Norway 18,228 5,142,842 1.17 2925
6 Qatar 2,766 2,350,549 14.88 2815
7 Denmark 23,081 5,661,723 -0.65 2812
8 Sweden 35,039 9,693,883 0.41 2775
9 Monaco 129 38,320 1.64 2683
10 Luxembourg 1,692 543,261 1.51 2564
11 Israel 18,040 7,919,528 3.71 2410
12 New Zealand 13,052 4,596,396 1.25 2352
13 Netherlands 51,434 16,844,195 -0.03 2238
14 Belgium 29,180 11,183,411 0.68 2058
15 Finland 17,551 5,460,592 -1.55 2034
16 Hong Kong 14,710 7,313,557 3.12 1997
17 Liechtenstein 102 37,461 -0.40 1967
18 Ireland 11,370 4,726,856 1.09 1959
19 Canada 89,312 35,871,283 0.13 1859
20 Austria 21,818 8,557,761 -0.09 1859
21 Slovenia 5,428 2,079,085 -0.43 1851
22 United Kingdom 169,483 63,843,856 -0.60 1818
23 Taiwan 34,011 23,381,038 4.53 1717
24 South Korea 73,433 49,750,234 3.61 1627
25 Greenland 125 57,275 0.05 1610
26 Czech Republic 20,759 10,777,060 1.02 1569
27 United States 567,007 325,127,634 0.51 1372
28 Portugal 21,159 10,610,014 -0.77 1359
29 Macao 819 584,420 3.20 1278
30 Spain 79,209 47,199,069 0.30 1277
31 Estonia 2,620 1,280,227 -2.23 1264
32 Germany 149,773 82,562,004 -0.77 1218
33 France 103,733 64,982,894 -0.08 1165
34 Grenada 140 106,694 3.33 1138
35 Poland 37,285 38,221,584 4.23 1120
36 Cyprus 1,789 1,164,695 -0.51 1088
37 Slovakia 6,271 5,457,889 2.67 1068
38 Malta 559 431,239 0.75 1000
39 Italy 95,836 61,142,221 -1.74 945
40 Greece 16,616 11,125,833 -1.67 934
41 Saint Kitts and Nevis 62 55,376 1.83 889
42 Croatia 5,533 4,255,374 -1.12 869
43 China 416,409 1,401,586,609 10.55 856
44 Saudi Arabia 17,529 29,897,741 5.90 768
45 Malaysia 23,414 30,651,176 2.95 756
46 Brunei Darussalam 366 428,539 1.03 668
47 Serbia 6,540 9,424,030 2.97 663
48 Hungary 9,478 9,911,396 -0.81 653
49 Lithuania 2,973 2,998,969 -1.86 629
50 Iran 39,727 79,476,308 5.02 626
51 Japan 109,305 126,818,019 -0.41 605
52 New Caledonia 171 263,147 3.75 580
53 San Marino 22 31,802 3.26 563
54 Seychelles 59 93,754 3.79 540
55 Chile 10,347 17,924,062 2.50 535
56 Latvia 1,503 2,031,361 -1.23 498
57 Tunisia 6,228 11,235,248 2.17 493
58 Bermuda 43 65,578 0.13 485
59 Palau 14 21,291 -0.22 481
60 Turkey 39,275 76,690,509 2.27 479
61 Romania 13,053 21,579,201 0.70 475
62 Lebanon 2,076 5,053,624 5.60 464
63 Montenegro 316 621,556 2.50 432
64 Dominica 37 72,680 2.90 416
65 Bulgaria 3,441 7,112,641 1.73 410
66 United Arab Emirates 3,858 9,577,128 2.30 358
67 Uruguay 1,208 3,429,997 4.39 354
68 Macedonia 814 2,109,251 3.01 347
69 Barbados 128 287,482 0.83 341
70 Russian Federation 57,881 142,098,141 0.36 312
71 Jordan 2,313 7,689,760 5.45 338
72 Oman 1,461 4,157,783 3.56 335
73 Brazil 61,122 203,657,210 3.70 332
74 French Polynesia 122 282,764 0.11 319
75 Kuwait 1,327 3,583,399 1.84 311
76 Iraq 1,793 35,766,702 27.77 295
77 South Africa 17,409 53,491,333 2.03 292
78 Argentina 11,815 42,154,914 2.17 253
79 Bahrain 344 1,359,726 5.20 252
80 Georgia 1,067 4,304,540 4.28 246
81 Armenia 953 2,989,467 -0.14 232
82 Andorra 24 80,950 -0.26 216
83 Fiji 231 892,727 1.95 212
84 Trinidad and Tobago 285 1,346,697 5.03 207
85 Egypt 14,800 84,705,681 4.49 198
86 Cuba 1,760 11,248,783 6.76 191
87 Bosnia and Herzegovina 756 3,819,684 2.95 177
88 Thailand 11,632 67,400,746 3.39 174
89 Guam 36 169,885 3.00 174
90 Colombia 7,500 49,529,208 4.28 163
91 Belarus 1,554 9,259,666 3.78 163
92 India 123,206 1,282,390,303 7.08 162
93 Azerbaijan 676 9,612,580 17.29 160
94 Botswana 410 2,056,370 1.11 157
95 Panama 485 3,987,866 8.46 151
96 Tuvalu 2 9,916 2.01 150
97 Mauritius 208 1,253,581 3.57 148
98 Kazakhstan 2,062 16,770,447 5.95 142
99 Libya 352 6,317,080 21.21 142
100 Costa Rica 720 5,001,657 3.88 137
101 Cayman Islands 11 59,967 -0.20 134
102 Morocco 4,079 33,955,157 5.00 134
103 Ukraine 8,868 44,646,131 -1.35 129
104 Algeria 5,171 40,633,464 3.75 129
105 Puerto Rico 660 3,680,058 -0.79 125
106 Namibia 286 2,392,370 6.15 125
107 Albania 406 3,196,981 4.32 121
108 Bhutan 82 776,461 10.04 121
109 Mongolia 298 2,923,050 8.01 118
110 Vanuatu 34 263,888 4.84 112
111 Palestine (West Bank & Gaza) 475 4,548,815 6.18 112
112 Mexico 18,417 125,235,587 0.21 110
113 Marshall Islands 7 52,993 0.88 99
114 Nigeria 5,112 183,523,432 18.20 97
115 Ecuador 1,418 16,225,691 4.25 88
116 Bahamas 46 387,549 -0.39 86
117 Federated States of Micronesia 12 104,460 -0.51 83
118 Moldova 348 3,436,828 1.71 82
119 Antigua and Barbuda 10 91,822 0.67 81
120 Ghana 1,531 26,984,328 8.97 81
121 Aruba 12 103,889 -2.26 80
122 Gabon 174 1,751,199 1.72 80
123 Jamaica 305 2,813,276 -0.77 76
124 Congo 388 4,671,142 3.59 76
125 Belize 32 347,598 2.69 74
126 Swaziland 106 1,285,519 2.38 68
127 Sri Lanka 1,255 21,611,842 6.27 67
128 Pakistan 10,962 188,144,040 4.64 66
129 Cape Verde 35 508,315 6.95 65
130 Solomon Islands 43 584,482 4.10 63
131 Gambia 157 1,970,081 1.36 63
132 Peru 1,813 31,161,167 5.10 63
133 Suriname 38 548,456 5.38 62
134 Venezuela 1,473 31,292,702 7.55 60
135 Maldives 22 357,981 7.57 57
136 Viet Nam 4,092 93,386,630 6.40 55
137 Samoa 13 193,228 0.76 50
138 Kenya 2,215 46,748,617 4.32 49
139 Tonga 7 106,379 -0.20 48
140 Saint Lucia 11 184,937 3.25 47
141 Cameroon 1,116 23,393,129 4.09 47
142 Senegal 691 14,967,446 4.22 45
143 Uganda 1,270 40,141,262 7.03 38
144 Laos 226 7,019,652 7.81 36
145 Benin 409 10,879,828 4.30 36
146 Kiribati 5 105,555 1.51 36
147 Guyana 34 807,611 2.53 34
148 Nepal 922 28,440,629 4.73 33
149 Malawi 519 17,308,685 5.75 32
150 Zambia 432 15,519,604 6.76 31
151 Burkina Faso 508 17,914,625 5.81 30
152 Indonesia 6,280 255,708,785 5.49 29
153 Ethiopia 1,691 98,942,102 11.11 29
154 Tanzania 1,261 52,290,796 6.56 28
155 Saint Vincent and the Grenadines 4 109,374 2.15 28
156 Bolivia 290 11,024,522 5.08 26
157 Rwanda 278 12,428,005 7.92 26
158 Paraguay 182 7,032,942 5.04 25
159 Kyrgyzstan 142 5,707,529 5.23 24
160 Syrian Arab Republic 502 22,264,996 5.07 23
161 Equatorial Guinea 17 799,372 12.91 23
162 Zimbabwe 552 15,046,102 -2.88 23
163 Bangladesh 3,011 160,411,249 6.06 22
164 Cambodia 317 15,677,059 6.67 22
165 Philippines 2,091 101,802,706 4.39 21
166 Papua New Guinea 156 7,631,819 6.48 21
167 Togo 156 7,170,797 3.56 19
168 Lesotho 43 2,120,116 5.09 18
169 Uzbekistan 426 29,709,932 8.46 18
170 Sierra Leone 112 6,318,575 6.20 17
171 Guinea-Bissau 37 1,787,793 3.77 17
172 Timor-Leste 23 1,172,668 4.25 16
173 Niger 169 19,268,380 18.20 16
174 Côte d’Ivoire 386 21,295,284 3.16 16
175 El Salvador 135 6,426,002 0.39 16
176 Sudan 597 39,613,217 4.66 15
177 Guatemala 243 16,255,094 3.42 13
178 Mali 239 16,258,587 3.18 13
179 Mozambique 299 27,121,827 8.06 13
180 Nicaragua 100 6,256,510 1.74 13
181 Tajikistan 107 8,610,384 7.05 13
182 Liberia 63 4,503,439 4.92 13
183 Djibouti 13 899,658 4.59 12
184 Yemen 297 25,535,086 4.38 11
185 Dominican Republic 116 10,652,135 5.81 11
186 Madagascar 278 24,235,390 1.56 9
187 Honduras 92 8,423,917 2.07 9
188 Mauritania 35 4,080,224 8.92 9
189 Comoros 8 770,058 1.95 8
190 Haïti 112 10,603,731 0.01 8
191 Sao Tome and Principe 2 202,781 6.19 8
192 Central African Republic 41 4,803,082 3.45 7
193 Guinea 106 12,347,766 2.35 7
194 Angola 83 22,819,926 12.50 5
195 Myanmar 181 54,164,262 10.42 4
196 Chad 38 13,605,625 16.86 4
197 Eritrea 29 6,737,634 3.86 4
198 Burundi 42 10,812,619 1.42 3
199 Afghanistan 74 32,006,788 11.27 3
200 North Korea 52 25,155,326 1.85 2
201 Turkmenistan 9 5,373,487 9.85 2
202 Democratic Republic of the Congo 75 71,246,355 5.92 1

The economic growth rate data comes from my essay The 12-Year Min-Max Average. Please see this essay for technical details on how the numbers were calculated.

Only “citable” scientific documents are counted, citable documents are generally higher in quality and more important than non-citable ones. However, citable and no-citable documents tend to rise and fall together, so that including non-citable documents shouldn’t have a significant effect on the HQI numbers.

Population data comes the United Nations and the World Bank. Scientific output data from SCIMago. Economic growth data from the World Bank and Trading Economics.

* A country’s GDP growth rate could be said to somewhat take into account its population growth, since when all other things are equal, growth in population results in economic growth. However, this will only apply to a stagnant economy whose only increase or decrease is a result of population change rather than

President Trump is already more than twice as famous as President Obama on the Internet

Google returns 174 million results for the search term “barack obama”, while returning 462 million results for “donald trump”. Donald Trump’s beats him by a factor of 2.65. This means that, if Google is telling the truth, Donald Trump already has more than twice as many mentions on the Internet than Barack Obama. Interesting for someone who has only been in office a little more than a month, versus eight years of media coverage for Obama’s presidency terms.

The 12-Year Min-Max Average: A Simple Method for Calculating Real, Legitimate Economic Growth and Canceling Out Central Bank Manipulations and other Noise

Introduction

Real economic growth is different from the increase in GDP that comes from monetary expansion. The 12-year min-max method that I have come up with is a way of calculating a country’s GDP growth rate over a 12-year period that aims to cancel out “fake” growth caused by monetary expansion and boom-bust cycles by taking recent economic crashes into account.

To find out China’s real economic growth from 2004 to 2015 (inclusive), find the year with the highest economic growth and the year with the lowest economic growth over the 12 year period, then average the two numbers. Over the 2004-2015 period, China’s highest economic growth was 14.7%, in 2007. Her lowest economic growth was 6.9%, in 2015. To find her real economic growth:

14.7 + 6.9
__________ = 10.8
    2

China’s GDP in 2004 was $1.9417 trillion. According to the above calculation, her economy grew at an annual rate of 10.8%, meaning that in 2015, her true GDP would be $5.999 trillion.

According to the above, China’s real economy in 2015 was three times as large as its 2004 economy. This finding is remarkably close to the 3.3 times growth of GDP from 2004 to 2015 predicted by PPP calculations ($5.7 trillion to 19.4 trillion).

Since the dollar is not a reliable store of value, the $5.999 trillion number for 2015 doesn’t mean much of anything, unless we compare it to the 2004 number of $1.94. The result, as mentioned, is that the 2015 number is three times larger, meaning the 2015 economy was three times as large as it used to be in 2004.

Another way of thinking of the above graph is to draw a rectangle with the country’s highest and lowest economic growth rates at opposing corners, then taking the midpoint of the height of the rectangle:

Extending the calculation to other countries, I will start with India:

Over the 2004-2015 period, India’s lowest growth rate was in 2008 at 3.89%. Its highest growth was in 2010 at 10.26%. Averaging the two results in 7.075%.

In 2004, India’s GDP was $0.7215 trillion. An annual growth rate of 7.075% results in a 2015 real GDP of $1.53 trillion, meaning its economy grew by a factor of 2.12. Both nominal and PPP calculations say its economy grew by a factor of 2.7. The 2.12 is quite believable to me, the truth probably lies somewhere in between.

Moving on to the United State:

America’s highest GDP growth was in 2004, at 3.79%. Its lowest growth was in 2009, at -2.78%. Averaging the two, the result is a miserable annual growth rate of half of a percent. America’s GDP in 2004 was $12.27 trillion. According to this calculation, its real 2015 GDP was $12.97 trillion, which fits the feelings of America’s population. America’s 2015 economy was only 5% larger than its 2004 economy from an honest, Smithian point of view. During the same period, its population grew 9.77% larger, meaning the wealth or income of America’s average citizen actually fell during the period. The pie grew by 5%, the pie eaters grew by 9.77%.

Predictably, Japan is even more of a trainwreck than the United States.

Over the 2004-2015 period, Japan’s high point of growth was in 2010 at 4.71%. Its low point was in 2009, at -5.53%. Averaging the two, the result is an annual growth rate of -0.41%, meaning its economy actually shrunk by that amount every year. This is well in keeping with a stagnant economy and an aging and shrinking population count. Japan’s GDP in 2004 was $4.65 trillion. According to this economic shrink rate, Japan’s GDP in 2015 was $4.45 trillion, 4.3% smaller than in 2004.

Why 12 Years

The average length of a central-bank induced asset bubble cycle is 8 years (think the late 2000 and 2008 crashes). 12 years is a cycle and a half. The 2004 to 2015 window, as an example, captures the recovery from the last crash, and our current “recovery”, providing a rich picture of what brought us here. If we look at two cycles (2000-2015 inclusive), the data will be skewed by the previous cycle’s peak, which is quite irrelevant today. If we look at only one cycle (2008-2015), we will lose historical context that is still relevant today (the period that lead to the 2008 crash).

A market cycle and a half makes for a relevant and informative picture of most periods of a country’s economic history. The idea of using a market cycle and a half comes from John P. Hussman, manager of the billion-dollar Hussman Funds mutual fund.

Why It Works

The 12-year min-max average takes a realistic look at the “fakeness” factor within an economy and takes it out. It shows how much of an economy is a house of cards built on debt and investor euphoria, and how much of it is real and of lasting value.

The basic idea is that it measures the psychology of an economy’s participants. Crashes happen when a very large number of investors realize it wasn’t such a smart idea to buy those overpriced assets, thinking that they would be able to sell them for even higher. This moment of realization happened in 1929, 2000 and 2008.

After a crash, central banks use monetary easing to motivate investors to bid up the prices of assets. This creates a growing atmosphere of euphoria that increases spending in the economy and creates years of apparent growth. When the next crash inevitably comes, the atmosphere changes from one of euphoria to one of fear and panic. The market sobers up. In this year of sobriety, investors often underestimate the market’s worth. This acts as an antidote to the overestimation of the market during euphoric years. This is what happened in March 2009.

The momentum of an economy that’s truly expanding cannot be reversed by a financial crisis. It can slow a little, but it will continue growing, as China, India and Bangladesh’s numbers show. When we average out the years of most euphoria and least euphoria in a fast-growing economy, we still get a high rate of growth, because the growth is real, it is not entirely based on the feelings of investors.

But how does investor feeling affect GDP? The blaze of euphoria caused by monetary easing and fanned by complicit mass media makes it easier, and more likely, for businesses to borrow and expand their activities, regardless of supply-and-demand considerations. Overvalued corporations find it easy to convince lenders to give them large loans. The wealthy from around the country open their wallets and outbid each other in investing their wealth in all kinds of business activities in fear of being left behind.

In stagnant economies (where standards of living for the average citizen are no longer improving appreciably) like the those of the US, Japan and Western Europe, it is by and large the feelings of investors that drive economic expansion and recession.

Measuring Crashiness

One obvious difficulty with choosing only two points on a 12-year growth graph is that growth is cumulative. A 3% growth at the beginning of the period could mean a trillion dollars increase, while at the end of the period it could mean two or three trillions.

Regardless of where the low point is on the graph, it shows that it is possible, within that economy, to lose this much value. It shows that a great amount of volatility exists within the economy, so that even if in recent years the growth numbers have all been great, if there is one big crash year on the 12-year graph, it tells us that a similar crash is in the future.

The cumulative effect doesn’t take away from the idea, the idea contains it within itself. No matter how much growth we’ve had in recent years, a crash can take most of it away, as it is farther in the future, so that its percentage effect is going to be larger than the effect of the growth of the previous years.

The PPP GDP per capita of the United States over the 12-year period  (denominated in 2005 international dollars) illustrates this. In 2004 it was $48,597. Five years of “growth” later, it was $48,557 in the 2009 crash. The crash easily outweighed all the previous years of growth. In 2015, the number had grown to $52,549, and the coming crash can easily take it back close to square one again.

The 12-year min-max average shows the “crashiness” of an economy. And since there is always a bigger crash in the future, measuring a country’s greatest year of growth against its worst year of growth makes a lot sense.

Honesty requires that I admit I came up with these reasonings for why the 12-year min-max average works after I had discovered it. I needed a reliable way of comparing the true economic momentums of different countries for the HQI, the Human Genetic-Cultural Quality Index that I will announce later, and among the methods I tried out, this one brilliantly fit the true states of many economies I have studied.

List of Countries by Real 12-Year Annual GDP Growth

Below is a list of 203 sovereign states along with their real economic growth from 2004 to 2015 according to the 12-year min-max average. The countries are sorted by population.

The number I’m most skeptical of is Germany’s. Germany has appeared to grow fast in recent years. The 12-year min-max average says its growth has actually been negative 0.77% (i.e. that the next crash will wipe out all of its recent growth). This is possible, and only history will tell.

Russia gets a 0.36% growth rate. I expect its rate will be shown to be quite higher after the next crash, as it puts the 2008 crash behind, and what remains will be its recent real economic growth rate that cannot be wiped out by a crash.

Please see the fine print at the end of the table regarding certain corrections I’ve made.

Country Population Real 12-Year Annual GDP Growth Rate (2004-2015)
China 1,401,586,609 10.545
India 1,282,390,303 7.075
United States 325,127,634 0.505
Indonesia 255,708,785 5.49
Brazil 203,657,210 3.7
Pakistan 188,144,040 4.64
Nigeria 183,523,432 18.195
Bangladesh 160,411,249 6.055
Russian Federation 142,098,141 0.36
Japan 126,818,019 -0.41
Mexico 125,235,587 0.205
Philippines 101,802,706 4.39
Ethiopia 98,942,102 11.11
Viet Nam 93,386,630 6.4
Egypt 84,705,681 4.485
Germany 82,562,004 -0.77
Iran 79,476,308 5.02
Turkey 76,690,509 2.265
Democratic Republic of the Congo 71,246,355 5.915
Thailand 67,400,746 3.385
France 64,982,894 -0.075
United Kingdom 63,843,856 -0.595
Italy 61,142,221 -1.735
Myanmar 54,164,262 10.415
South Africa 53,491,333 2.025
Tanzania 52,290,796 6.56
South Korea 49,750,234 3.605
Colombia 49,529,208 4.275
Spain 47,199,069 0.3
Kenya 46,748,617 4.315
Ukraine 44,646,131 -1.35
Argentina 42,154,914 2.17
Algeria 40,633,464 3.75
Uganda 40,141,262 7.025
Sudan 39,613,217 4.655
Poland 38,221,584 4.23
Canada 35,871,283 0.13
Iraq 35,766,702 27.77
Morocco 33,955,157 4.995
Afghanistan 32,006,788 11.27
Venezuela 31,292,702 7.545
Peru 31,161,167 5.095
Malaysia 30,651,176 2.95
Saudi Arabia 29,897,741 5.895
Uzbekistan 29,709,932 8.46
Nepal 28,440,629 4.73
Mozambique 27,121,827 8.06
Ghana 26,984,328 8.965
Yemen 25,535,086 4.38
North Korea 25,155,326 1.85
Madagascar 24,235,390 1.56
Australia 23,923,101 2.985
Cameroon 23,393,129 4.085
Taiwan 23,381,038 4.53
Angola 22,819,926 12.5
Syrian Arab Republic 22,264,996 5.065
Sri Lanka 21,611,842 6.27
Romania 21,579,201 0.695
Côte d’Ivoire 21,295,284 3.16
Niger 19,268,380 18.195
Chile 17,924,062 2.5
Burkina Faso 17,914,625 5.81
Malawi 17,308,685 5.745
Netherlands 16,844,195 -0.035
Kazakhstan 16,770,447 5.95
Mali 16,258,587 3.18
Guatemala 16,255,094 3.415
Ecuador 16,225,691 4.25
Cambodia 15,677,059 6.67
Zambia 15,519,604 6.76
Zimbabwe 15,046,102 -2.88
Senegal 14,967,446 4.22
Chad 13,605,625 16.855
Rwanda 12,428,005 7.92
Guinea 12,347,766 2.35
Cuba 11,248,783 6.76
Tunisia 11,235,248 2.165
Belgium 11,183,411 0.675
Greece 11,125,833 -1.67
Bolivia 11,024,522 5.08
Benin 10,879,828 4.295
Burundi 10,812,619 1.42
Czech Republic 10,777,060 1.02
Dominican Republic 10,652,135 5.805
Portugal 10,610,014 -0.77
Haïti 10,603,731 0.01
Hungary 9,911,396 -0.81
Sweden 9,693,883 0.405
Azerbaijan 9,612,580 17.285
United Arab Emirates 9,577,128 2.3
Serbia 9,424,030 2.965
Belarus 9,259,666 3.78
Tajikistan 8,610,384 7.05
Austria 8,557,761 -0.09
Honduras 8,423,917 2.07
Switzerland 8,238,610 1.005
Israel 7,919,528 3.705
Jordan 7,689,760 5.45
Papua New Guinea 7,631,819 6.48
Hong Kong 7,313,557 3.12
Togo 7,170,797 3.56
Bulgaria 7,112,641 1.73
Paraguay 7,032,942 5.035
Laos 7,019,652 7.81
Eritrea 6,737,634 3.855
El Salvador 6,426,002 0.39
Sierra Leone 6,318,575 6.195
Libya 6,317,080 21.205
Nicaragua 6,256,510 1.735
Kyrgyzstan 5,707,529 5.225
Denmark 5,661,723 -0.645
Singapore 5,618,866 7.32
Finland 5,460,592 -1.545
Slovakia 5,457,889 2.67
Turkmenistan 5,373,487 9.85
Norway 5,142,842 1.17
Lebanon 5,053,624 5.6
Costa Rica 5,001,657 3.88
Central African Republic 4,803,082 3.45
Ireland 4,726,856 1.085
Congo 4,671,142 3.585
New Zealand 4,596,396 1.25
Palestine (West Bank & Gaza) 4,548,815 6.175
Liberia 4,503,439 4.915
Georgia 4,304,540 4.28
Croatia 4,255,374 -1.115
Oman 4,157,783 3.555
Mauritania 4,080,224 8.915
Panama 3,987,866 8.46
Bosnia and Herzegovina 3,819,684 2.945
Puerto Rico 3,680,058 -0.785
Kuwait 3,583,399 1.84
Moldova 3,436,828 1.705
Uruguay 3,429,997 4.39
Albania 3,196,981 4.32
Lithuania 2,998,969 -1.86
Armenia 2,989,467 -0.14
Mongolia 2,923,050 8.01
Jamaica 2,813,276 -0.765
Namibia 2,392,370 6.15
Qatar 2,350,549 14.875
Lesotho 2,120,116 5.09
Macedonia 2,109,251 3.005
Slovenia 2,079,085 -0.43
Botswana 2,056,370 1.105
Latvia 2,031,361 -1.225
Gambia 1,970,081 1.36
Guinea-Bissau 1,787,793 3.765
Gabon 1,751,199 1.715
Bahrain 1,359,726 5.195
Trinidad and Tobago 1,346,697 5.025
Swaziland 1,285,519 2.375
Estonia 1,280,227 -2.225
Mauritius 1,253,581 3.565
Timor-Leste 1,172,668 4.245
Cyprus 1,164,695 -0.505
Djibouti 899,658 4.585
Fiji 892,727 1.945
Guyana 807,611 2.53
Equatorial Guinea 799,372 12.905
Bhutan 776,461 10.035
Comoros 770,058 1.95
Montenegro 621,556 2.5
Solomon Islands 584,482 4.1
Macao 584,420 3.2
Suriname 548,456 5.38
Luxembourg 543,261 1.51
Cape Verde 508,315 6.95
Malta 431,239 0.75
Brunei Darussalam 428,539 1.03
Bahamas 387,549 -0.39
Maldives 357,981 7.57
Belize 347,598 2.69
Iceland 336,728 2.405
Barbados 287,482 0.825
French Polynesia 282,764 0.11
Vanuatu 263,888 4.84
New Caledonia 263,147 3.75
Sao Tome and Principe 202,781 6.185
Samoa 193,228 0.755
Saint Lucia 184,937 3.25
Guam 169,885 3
Saint Vincent and the Grenadines 109,374 2.145
Grenada 106,694 3.33
Tonga 106,379 -0.2
Kiribati 105,555 1.505
Federated States of Micronesia 104,460 -0.505
Aruba 103,889 -2.26
Seychelles 93,754 3.785
Antigua and Barbuda 91,822 0.67
Andorra 80,950 -0.26
Dominica 72,680 2.895
Bermuda 65,578 0.13
Cayman Islands 59,967 -0.2
Greenland 57,275 0.05
Saint Kitts and Nevis 55,376 1.83
Marshall Islands 52,993 0.875
Monaco 38,320 1.64
Liechtenstein 37,461 -0.4
San Marino 31,802 3.255
Palau 21,291 -0.22
Tuvalu 9,916 2.01

For Iran, ignored the 2012 crash, as it was a political event. Used the 2008 crash instead, as it was a shared world event. For Brazil too due to 2015. For Iraq 2014 due to CIA-ISIS. For Venezuela, 2009 was used due to recent mismanagement. For Syria, 3.23 lowest growth from 2010 was used, due to start of the Syria v. CIA war in 2011. For Yemen, ignored numbers from 2011 due to the crisis, used lowest number from 2006.

Data for New Caledonia taken from Trading Economics (World Bank data missing).

Monaco’s highest growth rate taken from World Bank (14.58 for 2007). Lowest number (-11.3 for 2009) missing from World Bank, taken from Trading Economics.

Data for Greenland after 2009 is missing. Used 2009 number as lowest growth rate (-5.41), and 2007 number as highest growth rate (5.51).

No reliable annual growth data for French Polynesia. Assumed a top growth of 4.42 and a bottom growth of -4.2, as hinted at by the CIA World Factbook.

For Sierra Leone, ignored 2013 and 2015 numbers, as they were aberrations caused by the mining sector’s boom and collapse.

For Liechtenstein, top and bottom growth numbers were taken from Trading Economics as World Bank seemed inaccurate and missed the years after 2009.

Guadelope, Cook Islands, Montserrat, Netherlands Antilles, Anguilla, Martinique, Réunion, Gibraltar, American Samoa, US and British Virgin Islands, Northern Mariana Islands and French Guiana not included as GDP growth rate is not. It is possible that the World Bank counts them toward their parent states, couldn’t verify this.

Faroe Islands not included as GDP growth rate data is unavailable.

Data for North Korea, Guam and Cayman Islands’ GDP growth rate taken from Trading Economics as World Bank doesn’t provide them.

For the Central African Republic, numbers after 2012 are ignored due to the civil war there. Used 2004’s GDP growth rate as the top number (5.99) and 2005 as the bottom (0.91).

For Eritrea, ignored 2008 GDP growth low as it was caused by US sanctions. Used 2006 low instead (-0.97).

Somalia is not included in the World Bank data, and other available data is none too reliable due to the fact that the country is a war zone. Decided not to include the country as no useful conclusions can be drawn from the data.

No reliable data found for Turks and Caicos Islands, Wallis and Futuna, Nauru, Mayotte, and Western Sahara, so omitted them.

The calm before the 2017/18 crash

John Hussman’s latest Weekly Market Comment starts with these foreboding quotes:

“No Congress of the United States ever assembled, on surveying the State of the Union, has met with a more pleasant prospect than that which appears at the present time.”
- Calvin Coolidge, December 4, 1928

“There can be little argument that the American economy as it stands at the beginning of a new century has never exhibited so remarkable a prosperity for at least the majority of Americans.”
- Alan Greenspan, January 30, 2000

“We believe the effect of the troubles in the subprime sector on the broader housing market will be limited and we do not expect significant spillovers from the subprime market to the rest of the economy or to the financial system.”
- Ben Bernanke, May 17, 2007

“Investors haven’t been this optimistic on the global economy since 2011... A full 23 percent of investors expect an outright ‘boom,’ according to a survey released Tuesday by Bank of America Merrill Lynch... ‘The U.S. economy is not only humming on all cylinders, but in our view the optimism associated with a clean sweep by the Republicans in Washington is likely to create a self-fulfilling period of strong markets and at least the potential for strong growth.’ The optimism comes amid forecasts global growth will pick up and as Donald Trump promises to cut taxes, boost fiscal spending and loosen regulations in moves that could boost corporate earnings. ‘Macro optimism is surging,’ wrote the team.”
- Bloomberg, February 14, 2017

Recovering from a SAXParseException error with no data loss

I was working on a book I’m writing in LibreOffice Writer. I am using the docx format for the book, as I plan to finish its formatting in Microsoft Word, not knowing that LibreOffice Writer has a tendency to corrupt docx files. After closing and opening the file again, I received the following error:

I extracted the docx file (which is just a zip file, on Windows you can rename it to something.zip to extract or, while Ubuntu Linux allows you to extract it without renaming it). Found the document.xml file and opened it in VIM. I used the following command to jump to position 791513 on line 2:

791513l

That is the position number followed by a lowercase L.

I don’t see any error there, so LibreOffice Writer is not telling the truth, the error is not there. I opened document.xml in Chromium, but it reported the same wrong error position. Since the error message I received was saying the “w:cstheme” attribute was redefined, I decided to use regular expressions to search for it. I spent a stressful hour trying to learn VIM’s ridiculous regular expression syntax, but couldn’t figure it out.

In the end, I decided to use egrep instead. I ran the following command on the command line, which looks for a “w:cstheme” attribute that is not separated by a forward slash from antoher “w:cstheme” attribute, meaning it will find tags that have duplicate “w:cstheme” attributes, which is the error that LibreOffice Writer is reporting:

egrep "w:cstheme[^/]*w:cstheme" document.xml

And voila! It highlighted the error:

I copied the highlighted text (using ctrl+shift+c), opened document.xml again in VIM, and pasted the text in VIM’s seach bar (first press forward slash to open the search bar, then ctrl+shift+v to paste):

Pressing enter twice, it jumped right to the line and position (“column”) where the error was, which was actually position 817157:

If you understand html/xml, you will see the issue. To correct it, change this:

<w:rFonts w:eastAsia="Times New Roman" w:cs="Times New Roman" w:cstheme="majorBidi" w:ascii="Times New Roman" w:hAnsi="Times New Roman" w:cstheme="majorBidi"/>

To this, removing one of the unnecessary ‘w:cstheme=”majorbidi”‘ attributes:
<w:rFonts w:eastAsia="Times New Roman" w:cs="Times New Roman" w:cstheme="majorBidi" w:ascii="Times New Roman" w:hAnsi="Times New Roman" />

I searched again for the error in VIM, to make sure there were no repeated errors. I fixed multiple other occurrences of the error until I couldn’t find any more. Now, when opening the document.xml in Chromium, no error was reported:

This was a good sign. I made the mistake of compressing the parent folder of the document, renaming it to docx, and trying to open it. LibreOffice Writer said the document was corrupted and offered to fix it. It tried but failed. After a long time, I realized my error. I shouldn’t have compressed the parent folder, I should have compressed the files and folders inside the parent folder directly, as follows:

Above I have selected the files and folders that make up the docx document. I then right-clicked it and chose “Compress”, and chose the “zip” option. Below is the compressed file:

Next, I renamed the file to “occupy.docx_FILES.docx”:

Then I opened the file in LibreOffice Writer, and it worked!

To prevent this in the future, I will save the file in the ODF Text Document format (.odt), which is the native format used by LibreOffice that supposedly doesn’t suffer from this issue. Once the book is done, I will then save it as docx for use in Microsoft Word.

Charting the Strauss-Howe Generational Theory in 2017

Below is a chart (click it to zoom) that shows the seasonality of Anglo-American history since the end of the Middle Ages, according to the Strauss-Howe Generational Theory (as described in their 1997 book The Fourth Turning). Click here to download an enlarged version.

Below is the inner circles zoomed in (for those who don’t want to click the above chart to zoom in):

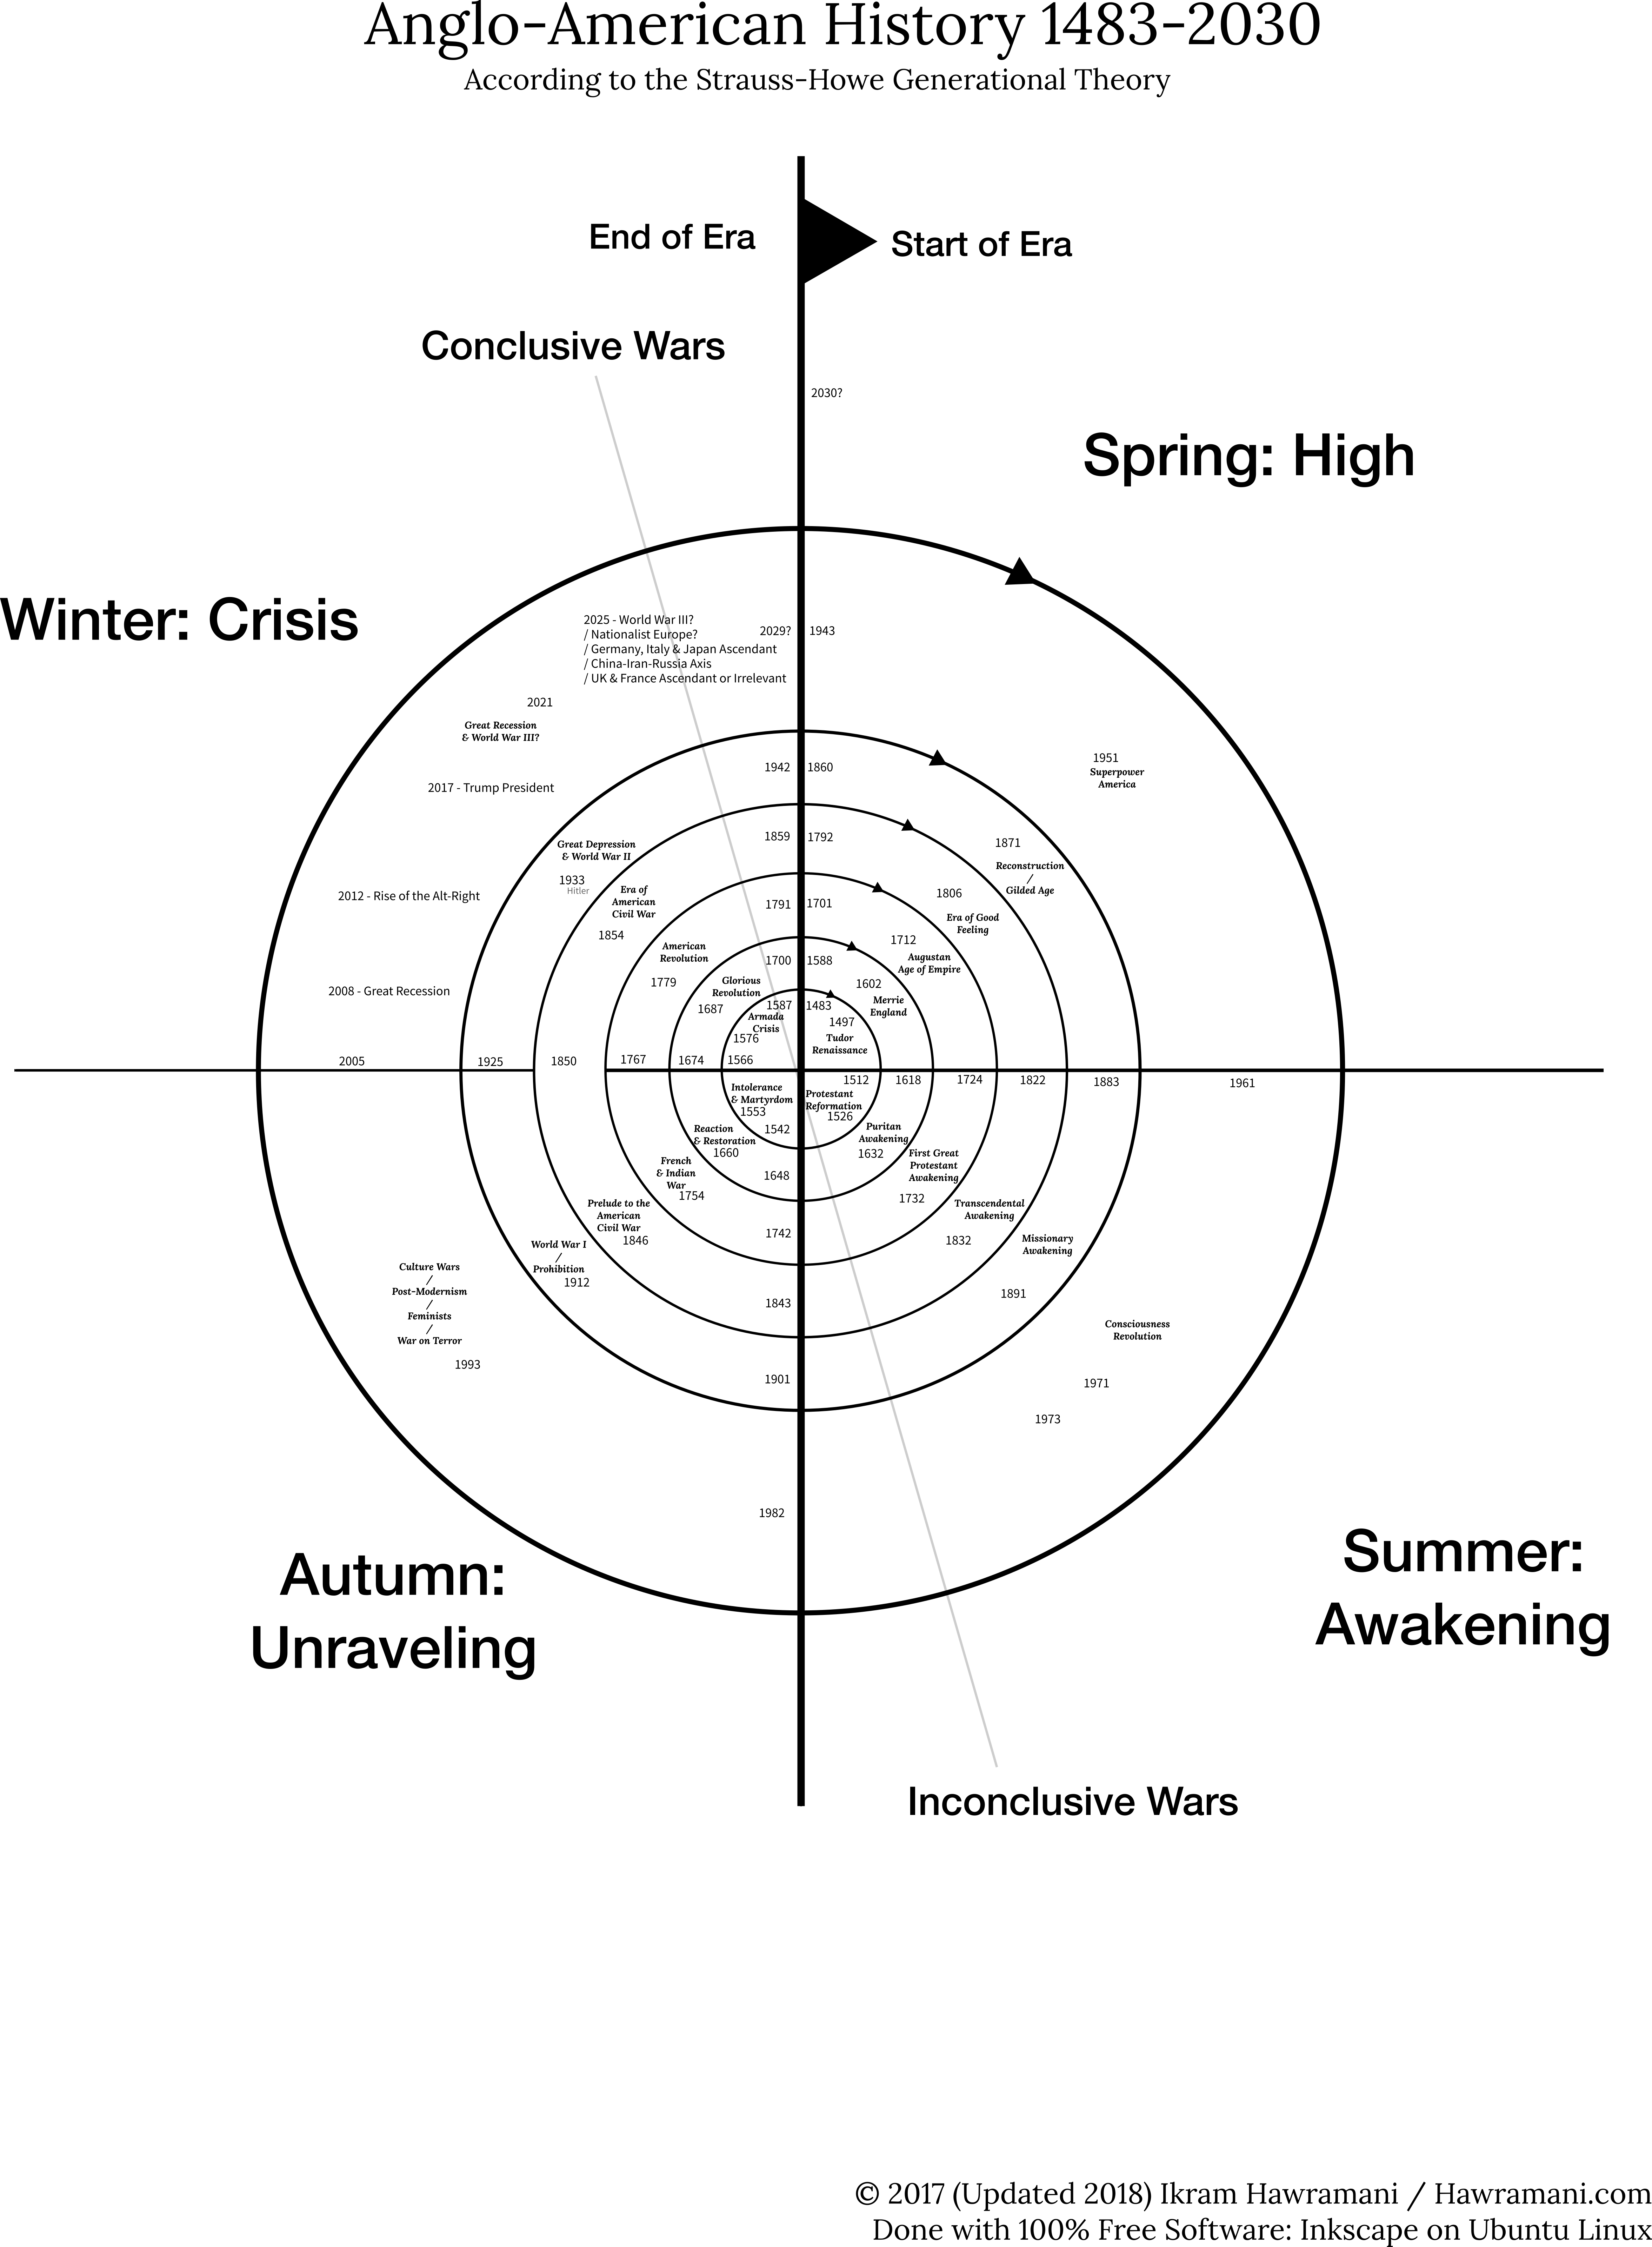
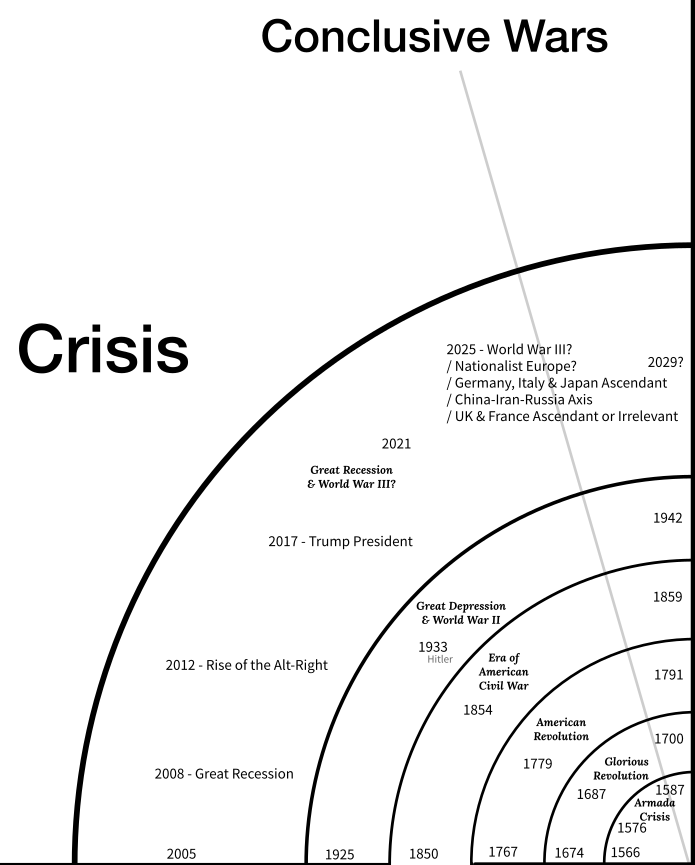
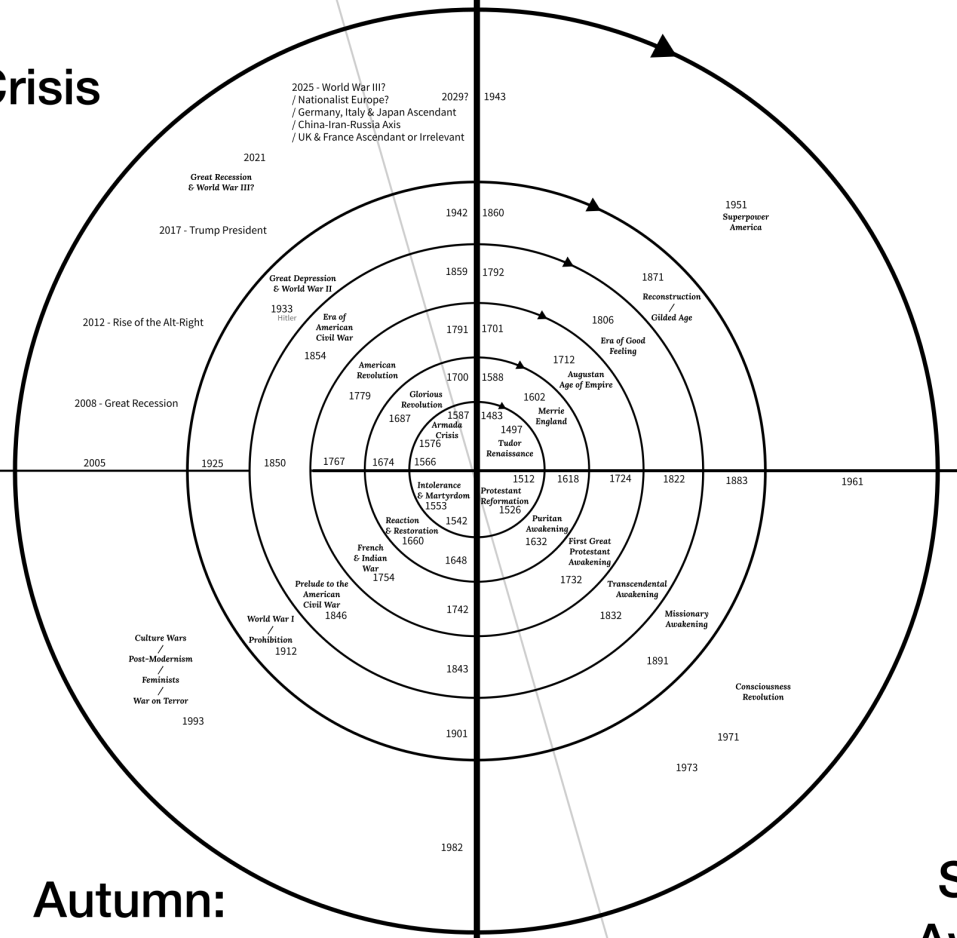
The “saeculum” is the word that Strauss-Howe use for each circle of the chart above, four seasons together make one saeculum. A saeculum is generally the length of one human life time, and its regularity has been noted since ancient times. We are currently living at the end of the saeculum that started in 1943, and which will probably end sometime between 2025 and 2035.

Below is the part of the chart that is most relevant to 2017. Many world leaders feel that we are approaching a major war. Countries are preparing for war, with Russia and China at the forefront, and Japan starting its own re-militarization program. According to the Strauss-Howe theory, 2017 is equivalent to 1933 (when Hitler got in charge and started rebuilding Germany’s army), 1854 (when the prospect of an American Civil War felt more and more imminent), and 1779 (the middle of the American Revolutionary War against Britain, and the year of the French Revolution). Needless to say, right now we are living in very interesting times.

[I updated these charts in 2018.]

Fixing jagged/aliased text on KDP/createSpace paperback covers

Upon publishing my new book, Object-Oriented PHP Best Practices, as an Amazon paperback, I was dismayed to see how ugly the cover looked on their site:

I had provided the book’s cover as a PDF saved from Photoshop. I realized that the issue was that Amazon’s software had trouble properly rasterizing the text in the PDF. For this reason, I went back to Photoshop, went to Layer -> Flatten Image to rasterize the image, then saved that as a separate PSD file (since you will lose all layers in the image, making the cover’s text impossible to edit in the future), and then from there saved it as a PDF. I uploaded the new cover to KDP, and a day or two later, I checked the paperback’s page and was happy to see that it looks good now:

Setting the default search path for Catfish File Search

The Problem

It was surprisingly difficult to find out how to set a default search path for Catfish. On the command line, you can simply do this to always make Catfish search from the root directory:

alias catfish='/usr/bin/catfish --path=\/'

But adding this line to your ~/.bashrc file will not affect the default search path for Catfish unless you launch it from the command line. What I wanted was to be able to click on the Catfish icon on the Unity launcher and have it launch in my root directory (so that it would search all my hard drives). Typically for a Linux program, Catfish’s settings do not offer a way to set this.

The Solution

The solution is to open up the file /usr/share/applications/catfish.desktop as root, for example by typing this on the command line:

gksudo gedit /usr/share/applications/catfish.desktop

Once the file opens up, change the Exec line near the bottom as follows, adding a --path=/some_path/ to the end of the line. Below, I’ve only put a forward slash as a path, meaning I want catfish to search everything, including all mounted hard drives.

Now, when I click the Catfish icon on the Unity launcher, the default search path is “File System”, which is how the program refers to the root directory.

When will the average flagship smartphone have a 5000 mAh battery? Probably around 2029

From 2007 to 2016, the iPhone’s battery grew from 1400 mAh in the first iPhone to 1960 mAh in the iPhone 7 (ignoring the new plus size iPhones). The energy density of lithium ion batteries grows at an exponential rate (5-8% a year), doubling every ten years, according to Tesla’s J.B. Straubel. The iPhone’s battery density growth is lagging this trend probably due to the continuous push for thinner phones.

Using Microsoft Excel’s exponential regression functionality, the following chart forecasts future iPhone battery sizes based on the available historical data, predicting that the small (non-plus) iPhone’s battery capacity will reach 5000 mAh around the year 2036:

Moving on to the more interesting new plus-sized iPhones, Excel cannot do an accurate automatic exponential regression due to the fact that there isn’t enough historical data available on the plus-sized iPhones. By examining the above chart and manually doing the regression using a second series, I found that Excel assumed an approximate rate of growth of 3.81%, and an approximate rate of growth of the rate of growth of 0.09%. Using these same rates on current iPhone Plus battery sizes, we get the following chart:

As it can be seen, around 2024 the iPhone Plus battery size reaches 4000 mAh, and around 2029 it reaches 5000 mAh. If the trend toward ever thinner phones slows, then the 5000 mAh smartphone battery might be achieved at an earlier date. I am hopeful that at least one large manufacturer is brave enough to bet on much larger batteries as a selling point, instead of following Apple’s lead in making things thinner and thinner.

When will smartphones have 1 terabyte of storage? Probably around 2021

While I’m no fan of Apple, the iPhone has so far been the leader in performance and storage. The internal storage of Apple’s latest and greatest iPhone provides a good benchmark for the current level of storage of the entire smartphone industry. When an iPhone with a new level of storage comes out, every manufacturer plays catch-up with Apple releases a flagship phone of similar storage.

Here is a chart that shows the trend in iPhone in internal storage. It extrapolates the trend into the future to predict when the iPhone will likely have one terabyte of internal storage (blue is historical storage levels, orange is predicted, and the dotted line is the trendline):

The chart assumes an exponential trend, since storage density and prices have followed an exponential increase and reduction trend.

I assumed that from 2018 through 2020, the iPhone will stay at 512 GB, similar to how it remained at 64 GB from 2011 through 2013. It is possible that instead of this, the iPhone will stay at 256 GB from 2017 through 2019. This will not significantly affect the historical trend.

Here is the same chart with the forecast extended to 2030. The trendline predicts an internal storage of 5 terabytes in 2027 and 10 terabytes in 2029.

I know that 10 terabytes in a smartphone may seem unnecessarily high. But historical trends show that every age can find good (and frivolous) uses for all the storage it can get.

Below is a table of every iPhone release date, device name, highest offered storage and battery capacity:

Release Date
Device Storage (GB)
Battery (mAh)
June 29, 2007 iPhone 1 16 1400
July 11, 2008 iPhone 3G 16 1150
June 19 2009 iPhone 3GS 32 1219
June 24, 2010 iPhone 4 32 1420
October 14, 2011 iPhone 4S 64 1432
September 21, 2012 iPhone 5 64 1440
September 20, 2013 iPhone 5S 64 1560
September 19, 2014 iPhone 6 128 1810
September 25, 2015 iPhone 6S 128 1715
September 16, 2016 iPhone 7 256 1960