Introduction
Real economic growth is different from the increase in GDP that comes from monetary expansion. The 12-year min-max method that I have come up with is a way of calculating a country’s GDP growth rate over a 12-year period that aims to cancel out “fake” growth caused by monetary expansion and boom-bust cycles by taking recent economic crashes into account.
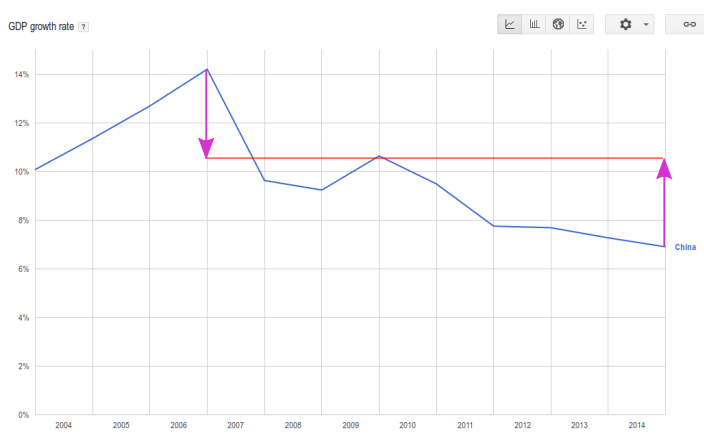 To find out China’s real economic growth from 2004 to 2015 (inclusive), find the year with the highest economic growth and the year with the lowest economic growth over the 12 year period, then average the two numbers. Over the 2004-2015 period, China’s highest economic growth was 14.7%, in 2007. Her lowest economic growth was 6.9%, in 2015. To find her real economic growth:
14.7 + 6.9
__________ = 10.8
    2
China’s GDP in 2004 was $1.9417 trillion. According to the above calculation, her economy grew at an annual rate of 10.8%, meaning that in 2015, her true GDP would be $5.999 trillion.
According to the above, China’s real economy in 2015 was three times as large as its 2004 economy. This finding is remarkably close to the 3.3 times growth of GDP from 2004 to 2015 predicted by PPP calculations ($5.7 trillion to 19.4 trillion).
Since the dollar is not a reliable store of value, the $5.999 trillion number for 2015 doesn’t mean much of anything, unless we compare it to the 2004 number of $1.94. The result, as mentioned, is that the 2015 number is three times larger, meaning the 2015 economy was three times as large as it used to be in 2004.
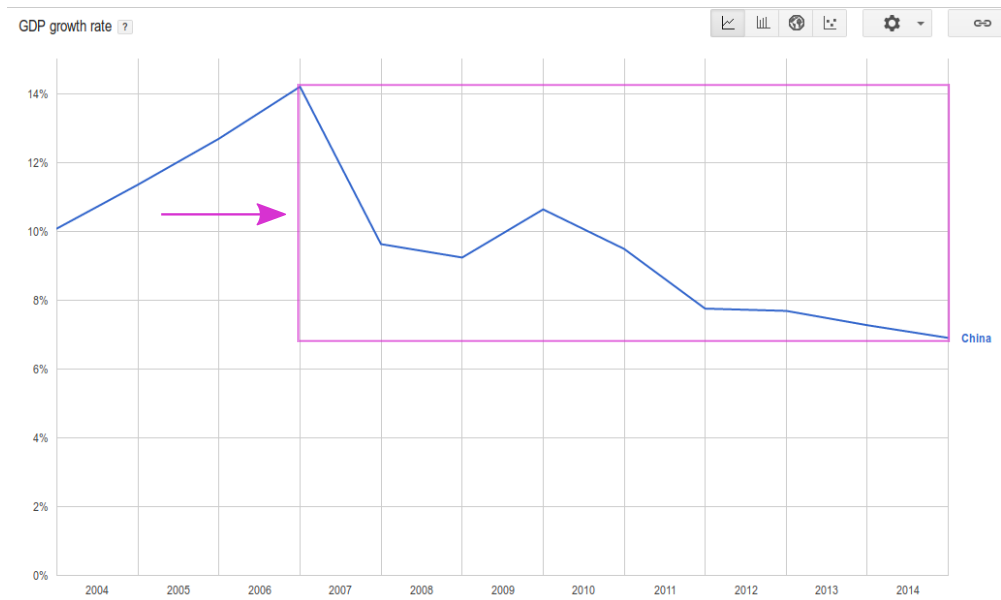
Another way of thinking of the above graph is to draw a rectangle with the country’s highest and lowest economic growth rates at opposing corners, then taking the midpoint of the height of the rectangle:
 Extending the calculation to other countries, I will start with India:
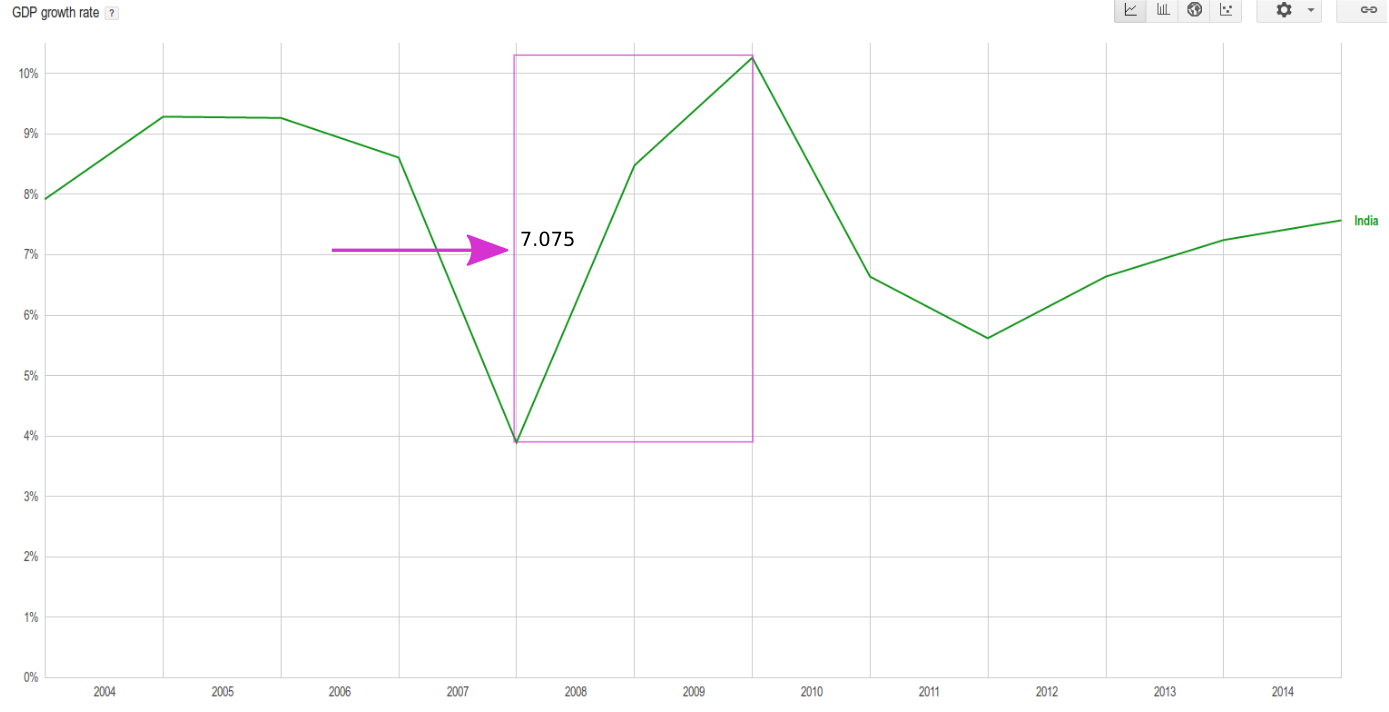 Over the 2004-2015 period, India’s lowest growth rate was in 2008 at 3.89%. Its highest growth was in 2010 at 10.26%. Averaging the two results in 7.075%.
In 2004, India’s GDP was $0.7215 trillion. An annual growth rate of 7.075% results in a 2015 real GDP of $1.53 trillion, meaning its economy grew by a factor of 2.12. Both nominal and PPP calculations say its economy grew by a factor of 2.7. The 2.12 is quite believable to me, the truth probably lies somewhere in between.
Moving on to the United State:
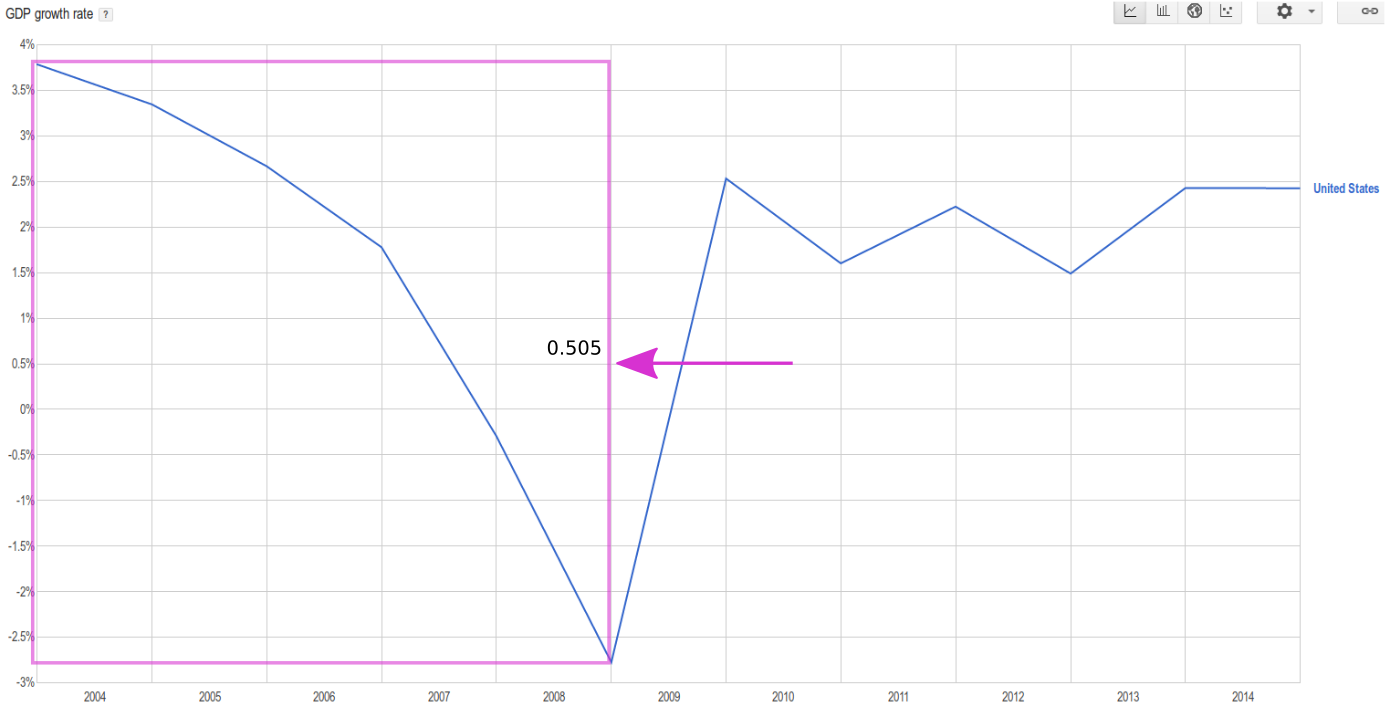 America’s highest GDP growth was in 2004, at 3.79%. Its lowest growth was in 2009, at -2.78%. Averaging the two, the result is a miserable annual growth rate of half of a percent. America’s GDP in 2004 was $12.27 trillion. According to this calculation, its real 2015 GDP was $12.97 trillion, which fits the feelings of America’s population. America’s 2015 economy was only 5% larger than its 2004 economy from an honest, Smithian point of view. During the same period, its population grew 9.77% larger, meaning the wealth or income of America’s average citizen actually fell during the period. The pie grew by 5%, the pie eaters grew by 9.77%.
Predictably, Japan is even more of a trainwreck than the United States.
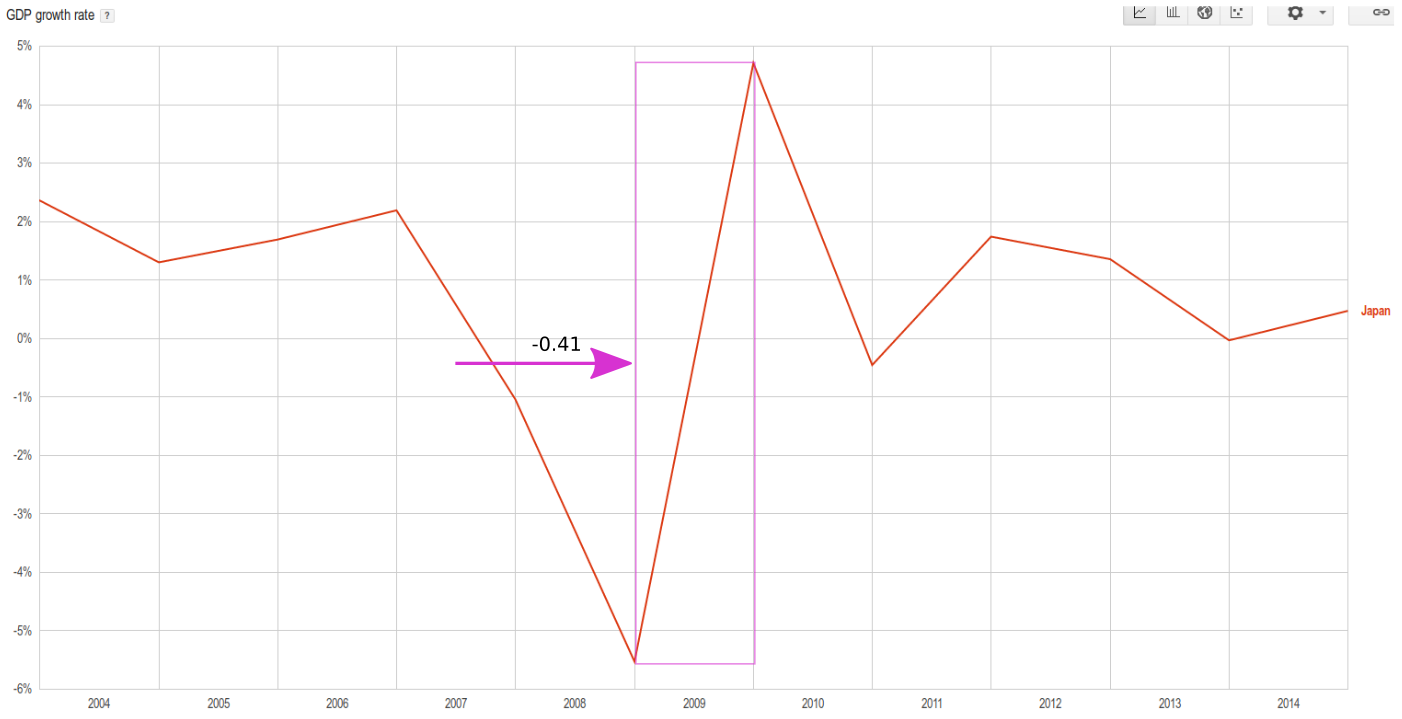 Over the 2004-2015 period, Japan’s high point of growth was in 2010 at 4.71%. Its low point was in 2009, at -5.53%. Averaging the two, the result is an annual growth rate of -0.41%, meaning its economy actually shrunk by that amount every year. This is well in keeping with a stagnant economy and an aging and shrinking population count. Japan’s GDP in 2004 was $4.65 trillion. According to this economic shrink rate, Japan’s GDP in 2015 was $4.45 trillion, 4.3% smaller than in 2004.
Why 12 Years
The average length of a central-bank induced asset bubble cycle is 8 years (think the late 2000 and 2008 crashes). 12 years is a cycle and a half. The 2004 to 2015 window, as an example, captures the recovery from the last crash, and our current “recovery”, providing a rich picture of what brought us here. If we look at two cycles (2000-2015 inclusive), the data will be skewed by the previous cycle’s peak, which is quite irrelevant today. If we look at only one cycle (2008-2015), we will lose historical context that is still relevant today (the period that lead to the 2008 crash).
A market cycle and a half makes for a relevant and informative picture of most periods of a country’s economic history. The idea of using a market cycle and a half comes from John P. Hussman, manager of the billion-dollar Hussman Funds mutual fund.
Why It Works
The 12-year min-max average takes a realistic look at the “fakeness” factor within an economy and takes it out. It shows how much of an economy is a house of cards built on debt and investor euphoria, and how much of it is real and of lasting value.
The basic idea is that it measures the psychology of an economy’s participants. Crashes happen when a very large number of investors realize it wasn’t such a smart idea to buy those overpriced assets, thinking that they would be able to sell them for even higher. This moment of realization happened in 1929, 2000 and 2008.
After a crash, central banks use monetary easing to motivate investors to bid up the prices of assets. This creates a growing atmosphere of euphoria that increases spending in the economy and creates years of apparent growth. When the next crash inevitably comes, the atmosphere changes from one of euphoria to one of fear and panic. The market sobers up. In this year of sobriety, investors often underestimate the market’s worth. This acts as an antidote to the overestimation of the market during euphoric years. This is what happened in March 2009.
The momentum of an economy that’s truly expanding cannot be reversed by a financial crisis. It can slow a little, but it will continue growing, as China, India and Bangladesh’s numbers show. When we average out the years of most euphoria and least euphoria in a fast-growing economy, we still get a high rate of growth, because the growth is real, it is not entirely based on the feelings of investors.
But how does investor feeling affect GDP? The blaze of euphoria caused by monetary easing and fanned by complicit mass media makes it easier, and more likely, for businesses to borrow and expand their activities, regardless of supply-and-demand considerations. Overvalued corporations find it easy to convince lenders to give them large loans. The wealthy from around the country open their wallets and outbid each other in investing their wealth in all kinds of business activities in fear of being left behind.
In stagnant economies (where standards of living for the average citizen are no longer improving appreciably) like the those of the US, Japan and Western Europe, it is by and large the feelings of investors that drive economic expansion and recession.
Measuring Crashiness
One obvious difficulty with choosing only two points on a 12-year growth graph is that growth is cumulative. A 3% growth at the beginning of the period could mean a trillion dollars increase, while at the end of the period it could mean two or three trillions.
Regardless of where the low point is on the graph, it shows that it is possible, within that economy, to lose this much value. It shows that a great amount of volatility exists within the economy, so that even if in recent years the growth numbers have all been great, if there is one big crash year on the 12-year graph, it tells us that a similar crash is in the future.
The cumulative effect doesn’t take away from the idea, the idea contains it within itself. No matter how much growth we’ve had in recent years, a crash can take most of it away, as it is farther in the future, so that its percentage effect is going to be larger than the effect of the growth of the previous years.
The PPP GDP per capita of the United States over the 12-year period (denominated in 2005 international dollars) illustrates this. In 2004 it was $48,597. Five years of “growth” later, it was $48,557 in the 2009 crash. The crash easily outweighed all the previous years of growth. In 2015, the number had grown to $52,549, and the coming crash can easily take it back close to square one again.
The 12-year min-max average shows the “crashiness” of an economy. And since there is always a bigger crash in the future, measuring a country’s greatest year of growth against its worst year of growth makes a lot sense.
Honesty requires that I admit I came up with these reasonings for why the 12-year min-max average works after I had discovered it. I needed a reliable way of comparing the true economic momentums of different countries for the HQI, the Human Genetic-Cultural Quality Index that I will announce later, and among the methods I tried out, this one brilliantly fit the true states of many economies I have studied.
List of Countries by Real 12-Year Annual GDP Growth
Below is a list of 203 sovereign states along with their real economic growth from 2004 to 2015 according to the 12-year min-max average. The countries are sorted by population.
The number I’m most skeptical of is Germany’s. Germany has appeared to grow fast in recent years. The 12-year min-max average says its growth has actually been negative 0.77% (i.e. that the next crash will wipe out all of its recent growth). This is possible, and only history will tell.
Russia gets a 0.36% growth rate. I expect its rate will be shown to be quite higher after the next crash, as it puts the 2008 crash behind, and what remains will be its recent real economic growth rate that cannot be wiped out by a crash.
Please see the fine print at the end of the table regarding certain corrections I’ve made.
| Country | Population | Real 12-Year Annual GDP Growth Rate (2004-2015) |
| China | 1,401,586,609 | 10.545 |
| India | 1,282,390,303 | 7.075 |
| United States | 325,127,634 | 0.505 |
| Indonesia | 255,708,785 | 5.49 |
| Brazil | 203,657,210 | 3.7 |
| Pakistan | 188,144,040 | 4.64 |
| Nigeria | 183,523,432 | 18.195 |
| Bangladesh | 160,411,249 | 6.055 |
| Russian Federation | 142,098,141 | 0.36 |
| Japan | 126,818,019 | -0.41 |
| Mexico | 125,235,587 | 0.205 |
| Philippines | 101,802,706 | 4.39 |
| Ethiopia | 98,942,102 | 11.11 |
| Viet Nam | 93,386,630 | 6.4 |
| Egypt | 84,705,681 | 4.485 |
| Germany | 82,562,004 | -0.77 |
| Iran | 79,476,308 | 5.02 |
| Turkey | 76,690,509 | 2.265 |
| Democratic Republic of the Congo | 71,246,355 | 5.915 |
| Thailand | 67,400,746 | 3.385 |
| France | 64,982,894 | -0.075 |
| United Kingdom | 63,843,856 | -0.595 |
| Italy | 61,142,221 | -1.735 |
| Myanmar | 54,164,262 | 10.415 |
| South Africa | 53,491,333 | 2.025 |
| Tanzania | 52,290,796 | 6.56 |
| South Korea | 49,750,234 | 3.605 |
| Colombia | 49,529,208 | 4.275 |
| Spain | 47,199,069 | 0.3 |
| Kenya | 46,748,617 | 4.315 |
| Ukraine | 44,646,131 | -1.35 |
| Argentina | 42,154,914 | 2.17 |
| Algeria | 40,633,464 | 3.75 |
| Uganda | 40,141,262 | 7.025 |
| Sudan | 39,613,217 | 4.655 |
| Poland | 38,221,584 | 4.23 |
| Canada | 35,871,283 | 0.13 |
| Iraq | 35,766,702 | 27.77 |
| Morocco | 33,955,157 | 4.995 |
| Afghanistan | 32,006,788 | 11.27 |
| Venezuela | 31,292,702 | 7.545 |
| Peru | 31,161,167 | 5.095 |
| Malaysia | 30,651,176 | 2.95 |
| Saudi Arabia | 29,897,741 | 5.895 |
| Uzbekistan | 29,709,932 | 8.46 |
| Nepal | 28,440,629 | 4.73 |
| Mozambique | 27,121,827 | 8.06 |
| Ghana | 26,984,328 | 8.965 |
| Yemen | 25,535,086 | 4.38 |
| North Korea | 25,155,326 | 1.85 |
| Madagascar | 24,235,390 | 1.56 |
| Australia | 23,923,101 | 2.985 |
| Cameroon | 23,393,129 | 4.085 |
| Taiwan | 23,381,038 | 4.53 |
| Angola | 22,819,926 | 12.5 |
| Syrian Arab Republic | 22,264,996 | 5.065 |
| Sri Lanka | 21,611,842 | 6.27 |
| Romania | 21,579,201 | 0.695 |
| Côte d’Ivoire | 21,295,284 | 3.16 |
| Niger | 19,268,380 | 18.195 |
| Chile | 17,924,062 | 2.5 |
| Burkina Faso | 17,914,625 | 5.81 |
| Malawi | 17,308,685 | 5.745 |
| Netherlands | 16,844,195 | -0.035 |
| Kazakhstan | 16,770,447 | 5.95 |
| Mali | 16,258,587 | 3.18 |
| Guatemala | 16,255,094 | 3.415 |
| Ecuador | 16,225,691 | 4.25 |
| Cambodia | 15,677,059 | 6.67 |
| Zambia | 15,519,604 | 6.76 |
| Zimbabwe | 15,046,102 | -2.88 |
| Senegal | 14,967,446 | 4.22 |
| Chad | 13,605,625 | 16.855 |
| Rwanda | 12,428,005 | 7.92 |
| Guinea | 12,347,766 | 2.35 |
| Cuba | 11,248,783 | 6.76 |
| Tunisia | 11,235,248 | 2.165 |
| Belgium | 11,183,411 | 0.675 |
| Greece | 11,125,833 | -1.67 |
| Bolivia | 11,024,522 | 5.08 |
| Benin | 10,879,828 | 4.295 |
| Burundi | 10,812,619 | 1.42 |
| Czech Republic | 10,777,060 | 1.02 |
| Dominican Republic | 10,652,135 | 5.805 |
| Portugal | 10,610,014 | -0.77 |
| Haïti | 10,603,731 | 0.01 |
| Hungary | 9,911,396 | -0.81 |
| Sweden | 9,693,883 | 0.405 |
| Azerbaijan | 9,612,580 | 17.285 |
| United Arab Emirates | 9,577,128 | 2.3 |
| Serbia | 9,424,030 | 2.965 |
| Belarus | 9,259,666 | 3.78 |
| Tajikistan | 8,610,384 | 7.05 |
| Austria | 8,557,761 | -0.09 |
| Honduras | 8,423,917 | 2.07 |
| Switzerland | 8,238,610 | 1.005 |
| Israel | 7,919,528 | 3.705 |
| Jordan | 7,689,760 | 5.45 |
| Papua New Guinea | 7,631,819 | 6.48 |
| Hong Kong | 7,313,557 | 3.12 |
| Togo | 7,170,797 | 3.56 |
| Bulgaria | 7,112,641 | 1.73 |
| Paraguay | 7,032,942 | 5.035 |
| Laos | 7,019,652 | 7.81 |
| Eritrea | 6,737,634 | 3.855 |
| El Salvador | 6,426,002 | 0.39 |
| Sierra Leone | 6,318,575 | 6.195 |
| Libya | 6,317,080 | 21.205 |
| Nicaragua | 6,256,510 | 1.735 |
| Kyrgyzstan | 5,707,529 | 5.225 |
| Denmark | 5,661,723 | -0.645 |
| Singapore | 5,618,866 | 7.32 |
| Finland | 5,460,592 | -1.545 |
| Slovakia | 5,457,889 | 2.67 |
| Turkmenistan | 5,373,487 | 9.85 |
| Norway | 5,142,842 | 1.17 |
| Lebanon | 5,053,624 | 5.6 |
| Costa Rica | 5,001,657 | 3.88 |
| Central African Republic | 4,803,082 | 3.45 |
| Ireland | 4,726,856 | 1.085 |
| Congo | 4,671,142 | 3.585 |
| New Zealand | 4,596,396 | 1.25 |
| Palestine (West Bank & Gaza) | 4,548,815 | 6.175 |
| Liberia | 4,503,439 | 4.915 |
| Georgia | 4,304,540 | 4.28 |
| Croatia | 4,255,374 | -1.115 |
| Oman | 4,157,783 | 3.555 |
| Mauritania | 4,080,224 | 8.915 |
| Panama | 3,987,866 | 8.46 |
| Bosnia and Herzegovina | 3,819,684 | 2.945 |
| Puerto Rico | 3,680,058 | -0.785 |
| Kuwait | 3,583,399 | 1.84 |
| Moldova | 3,436,828 | 1.705 |
| Uruguay | 3,429,997 | 4.39 |
| Albania | 3,196,981 | 4.32 |
| Lithuania | 2,998,969 | -1.86 |
| Armenia | 2,989,467 | -0.14 |
| Mongolia | 2,923,050 | 8.01 |
| Jamaica | 2,813,276 | -0.765 |
| Namibia | 2,392,370 | 6.15 |
| Qatar | 2,350,549 | 14.875 |
| Lesotho | 2,120,116 | 5.09 |
| Macedonia | 2,109,251 | 3.005 |
| Slovenia | 2,079,085 | -0.43 |
| Botswana | 2,056,370 | 1.105 |
| Latvia | 2,031,361 | -1.225 |
| Gambia | 1,970,081 | 1.36 |
| Guinea-Bissau | 1,787,793 | 3.765 |
| Gabon | 1,751,199 | 1.715 |
| Bahrain | 1,359,726 | 5.195 |
| Trinidad and Tobago | 1,346,697 | 5.025 |
| Swaziland | 1,285,519 | 2.375 |
| Estonia | 1,280,227 | -2.225 |
| Mauritius | 1,253,581 | 3.565 |
| Timor-Leste | 1,172,668 | 4.245 |
| Cyprus | 1,164,695 | -0.505 |
| Djibouti | 899,658 | 4.585 |
| Fiji | 892,727 | 1.945 |
| Guyana | 807,611 | 2.53 |
| Equatorial Guinea | 799,372 | 12.905 |
| Bhutan | 776,461 | 10.035 |
| Comoros | 770,058 | 1.95 |
| Montenegro | 621,556 | 2.5 |
| Solomon Islands | 584,482 | 4.1 |
| Macao | 584,420 | 3.2 |
| Suriname | 548,456 | 5.38 |
| Luxembourg | 543,261 | 1.51 |
| Cape Verde | 508,315 | 6.95 |
| Malta | 431,239 | 0.75 |
| Brunei Darussalam | 428,539 | 1.03 |
| Bahamas | 387,549 | -0.39 |
| Maldives | 357,981 | 7.57 |
| Belize | 347,598 | 2.69 |
| Iceland | 336,728 | 2.405 |
| Barbados | 287,482 | 0.825 |
| French Polynesia | 282,764 | 0.11 |
| Vanuatu | 263,888 | 4.84 |
| New Caledonia | 263,147 | 3.75 |
| Sao Tome and Principe | 202,781 | 6.185 |
| Samoa | 193,228 | 0.755 |
| Saint Lucia | 184,937 | 3.25 |
| Guam | 169,885 | 3 |
| Saint Vincent and the Grenadines | 109,374 | 2.145 |
| Grenada | 106,694 | 3.33 |
| Tonga | 106,379 | -0.2 |
| Kiribati | 105,555 | 1.505 |
| Federated States of Micronesia | 104,460 | -0.505 |
| Aruba | 103,889 | -2.26 |
| Seychelles | 93,754 | 3.785 |
| Antigua and Barbuda | 91,822 | 0.67 |
| Andorra | 80,950 | -0.26 |
| Dominica | 72,680 | 2.895 |
| Bermuda | 65,578 | 0.13 |
| Cayman Islands | 59,967 | -0.2 |
| Greenland | 57,275 | 0.05 |
| Saint Kitts and Nevis | 55,376 | 1.83 |
| Marshall Islands | 52,993 | 0.875 |
| Monaco | 38,320 | 1.64 |
| Liechtenstein | 37,461 | -0.4 |
| San Marino | 31,802 | 3.255 |
| Palau | 21,291 | -0.22 |
| Tuvalu | 9,916 | 2.01 |
For Iran, ignored the 2012 crash, as it was a political event. Used the 2008 crash instead, as it was a shared world event. For Brazil too due to 2015. For Iraq 2014 due to CIA-ISIS. For Venezuela, 2009 was used due to recent mismanagement. For Syria, 3.23 lowest growth from 2010 was used, due to start of the Syria v. CIA war in 2011. For Yemen, ignored numbers from 2011 due to the crisis, used lowest number from 2006.
Data for New Caledonia taken from Trading Economics (World Bank data missing).
Monaco’s highest growth rate taken from World Bank (14.58 for 2007). Lowest number (-11.3 for 2009) missing from World Bank, taken from Trading Economics.
Data for Greenland after 2009 is missing. Used 2009 number as lowest growth rate (-5.41), and 2007 number as highest growth rate (5.51).
No reliable annual growth data for French Polynesia. Assumed a top growth of 4.42 and a bottom growth of -4.2, as hinted at by the CIA World Factbook.
For Sierra Leone, ignored 2013 and 2015 numbers, as they were aberrations caused by the mining sector’s boom and collapse.
For Liechtenstein, top and bottom growth numbers were taken from Trading Economics as World Bank seemed inaccurate and missed the years after 2009.
Guadelope, Cook Islands, Montserrat, Netherlands Antilles, Anguilla, Martinique, Réunion, Gibraltar, American Samoa, US and British Virgin Islands, Northern Mariana Islands and French Guiana not included as GDP growth rate is not. It is possible that the World Bank counts them toward their parent states, couldn’t verify this.
Faroe Islands not included as GDP growth rate data is unavailable.
Data for North Korea, Guam and Cayman Islands’ GDP growth rate taken from Trading Economics as World Bank doesn’t provide them.
For the Central African Republic, numbers after 2012 are ignored due to the civil war there. Used 2004’s GDP growth rate as the top number (5.99) and 2005 as the bottom (0.91).
For Eritrea, ignored 2008 GDP growth low as it was caused by US sanctions. Used 2006 low instead (-0.97).
Somalia is not included in the World Bank data, and other available data is none too reliable due to the fact that the country is a war zone. Decided not to include the country as no useful conclusions can be drawn from the data.
No reliable data found for Turks and Caicos Islands, Wallis and Futuna, Nauru, Mayotte, and Western Sahara, so omitted them.