Introduction
What is the biggest predictor of a country’s scientific output, industrial capacity and military prowess? It is not geographic size. For instance, Kazakhstan and Mongolia are huge compared to Israel and Switzerland, yet Israel and Switzerland far outdistance them in all measures of intellectual, technological and military attainment.
It is not population. India’s 1.28 billion people are close in number to China’s 1.4 billion. And India has been a West-connected capitalist country since its independence in 1947, while China only started in the 1980’s. Yet China far outstrips India in all measures of technological and military power.
It is not natural resources. Russia has vastly more natural resources than Germany. Yet Germany’s economy is many times that of Russia, and its scientific output is double that of Russia, even though Russia’s population is close to double that of Germany.
The most important predictor of a country’s power and accomplishment is the nature of its population. A country’s most precious natural resource is its citizens. It is the genetic makeup of a population, enabled by supportive cultures, institutions and infrastructure, that predicts the country’s military-industrial power and capacity for innovation.
The book IQ and the Wealth of Nations by the professors Richard Lynn and Tatu Vanhanen makes a powerful argument for the importance of IQ in predicting a country’s power and prosperity, with IQ being a highly heritable (genetically-mediated) trait. While some of the data they use is not reliable, the general force of their argument is undeniable. The data used by Adam Smith and Charles Darwin were none too reliable either, but that didn’t stop their theories from being world-class accomplishments.
IQ is not everything. Japan’s IQ is in the same league as Germany and Sweden. Yet Swedes produce four times more science per citizen than the Japanese (measured in scientific papers published in peer-reviewed journals). Germans produce double the amount of science per citizen than the Japanese. An argument can be made that Japan’s infrastructure has yet to catch up with that of Western Europe. But Japan has had more than enough time (seven decades, in fact) to catch up. And a look at Japan’s infrastructure shows that they might even be ahead of Western Europe when it comes to infrastructure.
The factors that lead to Japan’s low accomplishment relative to Western Europe could be other genetic factors not widely studied. One factor could be Japan’s low testosterone levels compared to Europe, with testosterone being a significant contributor toward the drive for accomplishment1. Another factor could be aging. An aging population is going to be less productive than a younger one. Another factor could be non-genetic; for example cultural practices and ideals, although these factors are not independent of genetics and should be considered together with genetics2.
The Human Genetic-Cultural Quality Index
The HQI, short for the Human Genetic-Cultural Quality Index, takes account of both genetic and cultural factors to accurately predict a country’s real scientific, economic and military potential. It is a measure of the quality of human capital, a nation’s most important natural resource, and provides a single number that can be used to compare the quality of the human capital of different nations.
The math of the HQI will be explained below. For now, I will offer certain examples from it to illustrate the concept. Ukraine has an HQI of 129, while Russia’s HQI is 311. This means that a Russian citizen adds 2.6 times more value to Russia’s economy and scientific output than a Ukrainian citizen adds to Ukraine’s economy and scientific output. The quality of Russia’s human capital is 2.4 times that of Ukraine’s human capital. Even if Russia and Ukraine had exactly the same population (let’s say each had a population of 150 million), Russia would still be 2.4 times as powerful as Ukraine. Today, Russia’s population is 3.15 times as large as Ukraine’s (143.5 million vs. 45.49 million). Multiplying this by the 2.4 times HQI advantage, we arrive at a factor of 7.59. Russia is, or will be, 7.59 times as powerful as Ukraine when both countries reach their near-full development potential, perhaps in the next 30 years.
China’s HQI is 855. India’s is 162. Even if both countries had the same population, China would still be 5.2 times as powerful as India once both countries reach their near-full development potential.
The HQI uses two data points as predicting variables:
- Scientific papers per capita, which refers to the number of scientific papers published in a year by the nation, divided by its population. This measures the intellectual capacity of the nation’s population.
- Real economic growth rate. When a nation’s economy is growing fast (such as that of China), it shows that the nation’s institutions and infrastructure haven’t reached their full potential. The economic growth rate is used to correct for this fact. For instance, China’s papers per capita is only three times that of India’s. But China’s real 12-year average annual economic growth rate is 10.5%, while India’s is 7%. This means that the economic and scientific potential of China’s human capital has significantly more room to grow than India’s, as will be further illustrated down below.
The (real) economic growth rate of a nation expresses elasticity of human potential for a given nation. If growth is faster, improvements in infrastructure and institutions lead to big gains in the human potential of the nation, i.e. that the human potential of the nation is being held back by infrastructure and institutions, and that as these improve, so will the output of the nation’s human capital.
A slow economic growth rate indicates one of two things:
- The nation has reached close to its full potential, so that its human capital is already working at its full capacity. This is the case with slow-growing developed nations like Japan and the Netherlands.
- The quality of the nation’s human capital is so low that while theoretically there is much room for growth given the nation’s circumstances, that growth is being held back by human capital that’s not capable of achieving it. This is true in the case of various African and Latin American countries that have everything they could possibly need for growth, except a population that’s actually capable of said growth.
The history of colonization shows the importance of the genetic and cultural factors that go into the HQI. Any nation that becomes colonized by a high HQI population will quickly grow to reflect the home population’s intellectual prowess rather than the native population’s destitution. This has been true in the United States, Australia, Argentina, New Zealand and South Africa.
The most recent example comes from Israel. When Israel was colonized by Ashkenazi Jews that had been selected for high IQ in Europe during their 2000 year stay there3, Israel’s economy quickly grew to reflect a developed European nation, rather than a typical Middle Eastern one. It grew even above Eastern European nations, though it doesn’t seem likely it can surpass Germanic nations, as it has already had all the time and help it needs to achieve this.
The Mathematical Model
For any given nation and year, this is how the HQI basis number is calculated:
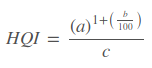 With a being the number of peer-reviewed scientific journal articles published in the year, b being the 12-year min-max average of economic growth4 for that year and the preceding 11 years, and c being the population of the nation in that year.
China published 416,409 peer-reviewed scientific journal papers in 2015. Its annual economic growth rate was 10.545 for the period 2004-2015 inclusive. And its population in 2015 was 1,401,586,609 (1.4 billion). The equation to calculate the HQI basis number thus becomes:
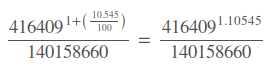 This results in a number of 0.001162729158. Since this is not a user-friendly number, the numbers for all nations are all multiplied by the arbitrary value of 735853.761, which gives an HQI of 1 to the lowest HQI country. This provides an easy-to-follow ground to which other countries can be compared. China’s HQI thus becomes 855.59. This means that a Chinese citizen adds a value to China’s economy that is 855.59 times greater than the value added by a citizen of the lowest HQI country to their respective economy (which happens to be the Democratic Republic of the Congo).
Raising the number of a country’s scientific papers to a power of (1 + its economic growth rate) is a mathematical trick that models both of these scenarios:
- Scientific output growth that continues at the rate of the country’s past 12-year economic growth rate for the next 11 years.
- Scientific output growth that starts off at the country’s average past 12-year economic growth, and then slows down by 6.95% every year over the next 30 years.
The assumption here is that a country’s scientific output will continue growing at the rate of the country’s economic growth over its past 12 years. This may seem a strange assumption, since a country’s future growth cannot be assumed to follow at the same rate as its past growth.
In fact, the correct assumption is that its economic growth will be quite lower. But what we are modeling here is not economic growth, it is growth in scientific output, whose future growth follows along the lines of a country’s past economic growth.
An example will make this clear. South Korea’s GDP grew from $771 billion USD in 2004 to $1.14 trillion in 2015 (all in 2000 dollars), a growth of about 48%. During the same period, its scientific output rose from 31182 papers in 2004 to 69469 papers in 2015, a growth of 122%, more than double its economic growth.
The growth in South Korea’s scientific output from 2004 to 2015 is actually similar to its GDP growth from 1989 to 2003 ($332 billion to $735 billion, a growth of 122%).
In short, scientific output is a lagging indicator of a country’s development, due to the amount of past investment necessary for its growth. No matter how much a country invests into increasing its scientific output, the tangible fruits of said investment will be over a decade in the future. The exception being countries like Saudi Arabia who rapidly increased their scientific output by importing foreign scientists.
India’s scientific output grew from 33031 papers in 2004 to 113144 papers in 2015, a growth of 242%. During the same period, its inflation-adjusted GDP grew from $0.971 trillion to $2.03 trillion, a growth of 109%. The growth in its scientific output was more than double the growth in its economic output.
Its growth, in fact, was similar to its GDP growth from 1981 to 2003. The reason for its slow economic growth over this period may have been its low-effectiveness gene-culture (low IQ, etc.), and its low urbanization rate accompanied by its vast size, that meant it took far longer than South Korea to build the infrastructure and institutions necessary to support effective scientific research.
This phenomenon of scientific growth growing far faster than economic growth can be seen throughout the world. Needless to say, a more rigorous study of the relationship between scientific output and past economic growth can be done. But we can take it as a general rule that past economic growth predicts future scientific output growth.
China’s Coming Supremacy
Raising China’s 2015 scientific paper count of 416409 to a power of 1.105 (1 + its annual economic output growth over 2004-2015) results in 1620204, or 1.62 million. What this means is that once China reaches close to its full economic potential (perhaps after 2030), it will be producing about 1.62 million scientific papers every year. Compare this to the 567000 scientific papers published by the United States in 2015, which, according to the same HQI calculation, will grow to 606000 during the same period. In other words, in the next 20 or more years, China’s scientific output will be 2.67 times as large as that of the United States.
While this may sound controversial to someone who has been wooed by the nascent racism of neocons, globalists and central bank usurer economists in their propagandizing the idea that the US can somehow maintain a permanent technological edge over China, that despite China’s enormous growth and a scientific output that is closely approaching that of the United States, that there is something wrong with the Chinese that will forever keep them as second-class citizens on the world stage, to someone who understands the history of Japan and South Korea’s growth, and who understands the realities of the gene-culture, this conclusion of China’s approaching supremacy is merely stating the obvious.
Using the HQI for Comparative Study of Gene-Cultures and National Potentials
Below is a list of the world’s highest HQI nations (the full list is at the end), for the reader’s viewing pleasure, and to help you follow along the rest of the essay.
| Rank | Country | 2015 Citable Scientific Documents | 2015 Population | Average Real Annual Economic Growth (2004-2015) [12-Year Min-Max Method] | HQI | Predicted Scientific Output at Near-Full Potential (2035 and After) |
| 1 | Singapore | 17,976 | 5,618,866 | 7.32 | 4823 | 36,824 |
| 2 | Switzerland | 39,358 | 8,238,610 | 1.01 | 3910 | 43,774 |
| 3 | Australia | 82,567 | 23,923,101 | 2.99 | 3561 | 115,764 |
| 4 | Iceland | 1,365 | 336,728 | 2.41 | 3549 | 1,624 |
| 5 | Norway | 18,228 | 5,142,842 | 1.17 | 2925 | 20,445 |
| 6 | Qatar | 2,766 | 2,350,549 | 14.88 | 2815 | 8,991 |
| 7 | Denmark | 23,081 | 5,661,723 | -0.65 | 2812 | 21,633 |
| 8 | Sweden | 35,039 | 9,693,883 | 0.41 | 2775 | 36,556 |
| 9 | Monaco | 129 | 38,320 | 1.64 | 2683 | 140 |
| 10 | Luxembourg | 1,692 | 543,261 | 1.51 | 2564 | 1,893 |
| 11 | Israel | 18,040 | 7,919,528 | 3.71 | 2410 | 25,938 |
| 12 | New Zealand | 13,052 | 4,596,396 | 1.25 | 2352 | 14,693 |
| 13 | Netherlands | 51,434 | 16,844,195 | -0.03 | 2238 | 51,239 |
While the Qatari population have a higher IQ, and are more liberal, than most other Arab populations (perhaps with the exception of Lebanese Christians), their high HQI is strongly a result of their importation of foreign scientists on the one hand, and their fast growing oil revenue on the other, the latter funding the former.
Germanic nations have the highest HQI in the world. Switzerland and Iceland, with their relatively low immigration rates, show the high productivity of Germanic genes and cultures. Australia, Denmark, Norway, Sweden, New Zealand and the Netherlands, with their Germanic roots, follow along the same lines.
The table shows how the HQI can be used to compare the genetic-cultural quality of any two countries. Iceland’s HQI of 3548, divided by the 2238 HQI of the Netherlands, results in a 58% advantage for the Icelandic people. Icelandic people are 58% more capable and productive than Netherlanders, and if the two countries had the same population, Iceland would be 58% more powerful militarily, technologically and economically.
Israel’s high HQI is influenced by its high economic growth, a large portion of which comes from its cozy relationship with the United States (US intelligence agencies, for example, are reliant on many Israeli technology companies). It’s highly unlikely that its population is more capable than that of the Netherlands or New Zealand. This shows that the HQI is not immune to aberrations, similar to all other methods, as reality is full of aberrations caused by disasters, sanctions, wars and political changes.
But regarding Israel, the HQI shows one very important result: Israel is already close to its full scientific potential. Over the next 30 years or so, its scientific output can grow from 18040 papers to 21631. No great improvement can be expected from Israel, and given its precarious political situation, even this much growth may not be possible, though stranger things have happened.
Changes in HQI Reflect Fundamental Genetic-Cultural Changes in a Nation
Far more interesting than a country’s economic growth is HQI growth. The HQI itself is a measure of growth potential, HQI growth means growth in the growth potential. When a nation climbs toward a peak in achievement, economic growth refers to this climb. HQI growth refers to an increase in the height of the peak, a removal of constraints that prevent a nation from reaching the heights reached by other nations.
China’s 2015 HQI was 6.4% lower than its 2010 HQI. This means that between 2010 and 2015, there were some forces in effect that reduced China’s genetic-cultural fitness, or economic fitness, so that while it continued to grow fast, its predicted near-full potential decreased. This was mostly caused by a large drop in the number of scientific papers published by China in 2015. I have contacted SCImago to find out whether this change was due to changes in their paper counting methodologies or whether it was due to a real drop in China’s output. If it was a real drop, maybe it was due to China’s best and brightest aging and retiring, or due to growing practice of usury creating a Western European-style of stagnation faster than expected, or due to some unknown dysgenic effect.
From 2010 to 2015, Ethiopia’s HQI increased by 173%. This is a very, very good sign. It means that there are genetic-cultural changes that are improving the nation’s future potential, or that there are bottlenecks that are being overcome. Not only is the nation climbing toward the peak, the peak itself is growing. Perhaps it is due to improvements in nutrition and health care, or beneficial cultural changes, or both. The actual beneficial change is probably smaller.
Poland has been Europe’s favorite backwater since at least Adam Smith’s time. What does the HQI tell us about what is going on in there? From 2010 to 2015, Poland’s HQI increased by 21.9%. There are forces at work in Poland that are increasing its population’s genetic-cultural fitness, so that whatever we believed Poland’s maximum growth potential to have been in 2010, in 2015 that maximum growth potential was 21.9% higher.
The HQI of the United States decreased by 12.3% from 2010 to 2015. This means that there are forces at work reducing the genetic-cultural fitness of America’s average citizen. One simple explanation could be the increase in immigration from lower HQI nations, who increase the population of the US without significantly increasing its economic and scientific output. Keeping population constant, the HQI still decreased by 8.9%, therefore immigration might be only causing a 3.4 percentage points of this dysgenesis.
Germany’s HQI increased by 0.2% from 2010 to 2015, meaning that no interesting structural change happened. These numbers are from before the recent migrant crisis, whose presence is sure to bring down Germany’s HQI.
Japan’s HQI fell 15.7% from 2010 to 2015. Not only is the nation coming down the peak (through its negative economic growth), the nation’s peak is also decaying.
Russia’s HQI increased by 31.1% from 2010 to 2015. Even though its economic growth was low (0.36%), its scientific output greatly increased during this period, from 38878 papers to 55500. Russia’s seeming low GDP growth is largely due to economic warfare from Wall Street. Its scientific growth shows its true economic fitness.
Why Scientific Output is Important
The HQI uses scientific output as the most important indicator of a nation’s genetic-cultural fitness. There are many good reasons for this, the two most important being:
- Producing science requires that a nation be prosperous enough to afford having a class of society who dedicate most of their time to research. And that prosperity can only come from high genetic-cultural fitness for most countries, excepting a few oil states that can afford to import scientists.
- Producing science requires very high intellectual capacity and drive for accomplishment (perhaps most importantly IQ and testosterone). If a nation’s population is incapable of producing science, they will be equally incapable of producing high-tech military equipment and industrial innovation, necessary for a nation to increase its power.
A nation’s scientific output is a very good indicator of its fitness. If a nation’s economy is growing fast, by raising the scientific output to the power of its real economic growth, the HQI gives the nation a fair chance at proving itself. China’s scientific output per capita is quite low compared to that of the United States. But its real economic growth is much higher. We can safely assume that China’s per capita scientific output is going to grow at a rate similar to its past economic growth.
The Bottleneck Effect in the Growth of Scientific Output
India’s example shows that there might be a bottleneck effect in the growth of scientific output in large and highly undeveloped nations. As mentioned, India’s scientific output grew by 242% from 2004 to 2015, similar to its economic growth from 1981 to 2003. 12 years of scientific output growth were equal to 23 years of past economic growth. While in the case of South Korea, its 2004 to 2015 scientific growth was roughly similar to its economic growth of the 12 years preceding that.
India may have already overcome the bottleneck. Indonesia, Bangladesh, Pakistan, Nigeria, the Philippines and Vietnam probably haven’t yet, and this probably partly accounts for their low HQI’s.
For a large, undeveloped and already low-HQI nation (low IQ, bad law enforcement, etc.), building the prosperity and infrastructure necessary for doing science takes far longer than it takes a smaller and higher HQI nation. Decades of education, infrastructure building and perhaps most importantly, urbanization, are needed before a country’s scientific output momentum gets going.
List of 203 Sovereign States by Human Potential
Below is a table of 203 sovereign states sorted by HQI, from highest HQI to lowest. Note that the HQI number shows the genetic-cultural quality of each individual citizen within that nation, not the nation’s power. While each additional Singaporean citizen adds a value of 4822 to the economy of Singapore, each additional US citizen adds a value of 1372. Since the genetic-cultural quality of Singaporeans is so much higher than the genetic-cultural quality of US citizens, what the HQI shows is that if Singapore had the same number of citizens as the United States, it would 3.5 times as powerful as the United States, as each individual citizen adds so much more to its power and productivity. Singapore’s real superiority is probably lower, as it is mostly its fast economic growth, aided by its geo-political situation, that’s contributing to its high HQI.
The HQI for certain nations, such as Indonesia and North Korea, are clearly inaccurate due to their exclusion from the world’s scientific community. The HQI of Indonesia and many former Central Asian Soviet states should increase considerably as they start to adopt Western scientific practices.
Please see below the table for the fine print regarding the numbers.
| Rank | Country | 2015 Citable Scientific Documents | 2015 Population | Average Real Annual Economic Growth (2004-2015) [12-Year Min-Max Method] | HQI |
| 1 | Singapore | 17,976 | 5,618,866 | 7.32 | 4823 |
| 2 | Switzerland | 39,358 | 8,238,610 | 1.01 | 3910 |
| 3 | Australia | 82,567 | 23,923,101 | 2.99 | 3561 |
| 4 | Iceland | 1,365 | 336,728 | 2.41 | 3549 |
| 5 | Norway | 18,228 | 5,142,842 | 1.17 | 2925 |
| 6 | Qatar | 2,766 | 2,350,549 | 14.88 | 2815 |
| 7 | Denmark | 23,081 | 5,661,723 | -0.65 | 2812 |
| 8 | Sweden | 35,039 | 9,693,883 | 0.41 | 2775 |
| 9 | Monaco | 129 | 38,320 | 1.64 | 2683 |
| 10 | Luxembourg | 1,692 | 543,261 | 1.51 | 2564 |
| 11 | Israel | 18,040 | 7,919,528 | 3.71 | 2410 |
| 12 | New Zealand | 13,052 | 4,596,396 | 1.25 | 2352 |
| 13 | Netherlands | 51,434 | 16,844,195 | -0.03 | 2238 |
| 14 | Belgium | 29,180 | 11,183,411 | 0.68 | 2058 |
| 15 | Finland | 17,551 | 5,460,592 | -1.55 | 2034 |
| 16 | Hong Kong | 14,710 | 7,313,557 | 3.12 | 1997 |
| 17 | Liechtenstein | 102 | 37,461 | -0.40 | 1967 |
| 18 | Ireland | 11,370 | 4,726,856 | 1.09 | 1959 |
| 19 | Canada | 89,312 | 35,871,283 | 0.13 | 1859 |
| 20 | Austria | 21,818 | 8,557,761 | -0.09 | 1859 |
| 21 | Slovenia | 5,428 | 2,079,085 | -0.43 | 1851 |
| 22 | United Kingdom | 169,483 | 63,843,856 | -0.60 | 1818 |
| 23 | Taiwan | 34,011 | 23,381,038 | 4.53 | 1717 |
| 24 | South Korea | 73,433 | 49,750,234 | 3.61 | 1627 |
| 25 | Greenland | 125 | 57,275 | 0.05 | 1610 |
| 26 | Czech Republic | 20,759 | 10,777,060 | 1.02 | 1569 |
| 27 | United States | 567,007 | 325,127,634 | 0.51 | 1372 |
| 28 | Portugal | 21,159 | 10,610,014 | -0.77 | 1359 |
| 29 | Macao | 819 | 584,420 | 3.20 | 1278 |
| 30 | Spain | 79,209 | 47,199,069 | 0.30 | 1277 |
| 31 | Estonia | 2,620 | 1,280,227 | -2.23 | 1264 |
| 32 | Germany | 149,773 | 82,562,004 | -0.77 | 1218 |
| 33 | France | 103,733 | 64,982,894 | -0.08 | 1165 |
| 34 | Grenada | 140 | 106,694 | 3.33 | 1138 |
| 35 | Poland | 37,285 | 38,221,584 | 4.23 | 1120 |
| 36 | Cyprus | 1,789 | 1,164,695 | -0.51 | 1088 |
| 37 | Slovakia | 6,271 | 5,457,889 | 2.67 | 1068 |
| 38 | Malta | 559 | 431,239 | 0.75 | 1000 |
| 39 | Italy | 95,836 | 61,142,221 | -1.74 | 945 |
| 40 | Greece | 16,616 | 11,125,833 | -1.67 | 934 |
| 41 | Saint Kitts and Nevis | 62 | 55,376 | 1.83 | 889 |
| 42 | Croatia | 5,533 | 4,255,374 | -1.12 | 869 |
| 43 | China | 416,409 | 1,401,586,609 | 10.55 | 856 |
| 44 | Saudi Arabia | 17,529 | 29,897,741 | 5.90 | 768 |
| 45 | Malaysia | 23,414 | 30,651,176 | 2.95 | 756 |
| 46 | Brunei Darussalam | 366 | 428,539 | 1.03 | 668 |
| 47 | Serbia | 6,540 | 9,424,030 | 2.97 | 663 |
| 48 | Hungary | 9,478 | 9,911,396 | -0.81 | 653 |
| 49 | Lithuania | 2,973 | 2,998,969 | -1.86 | 629 |
| 50 | Iran | 39,727 | 79,476,308 | 5.02 | 626 |
| 51 | Japan | 109,305 | 126,818,019 | -0.41 | 605 |
| 52 | New Caledonia | 171 | 263,147 | 3.75 | 580 |
| 53 | San Marino | 22 | 31,802 | 3.26 | 563 |
| 54 | Seychelles | 59 | 93,754 | 3.79 | 540 |
| 55 | Chile | 10,347 | 17,924,062 | 2.50 | 535 |
| 56 | Latvia | 1,503 | 2,031,361 | -1.23 | 498 |
| 57 | Tunisia | 6,228 | 11,235,248 | 2.17 | 493 |
| 58 | Bermuda | 43 | 65,578 | 0.13 | 485 |
| 59 | Palau | 14 | 21,291 | -0.22 | 481 |
| 60 | Turkey | 39,275 | 76,690,509 | 2.27 | 479 |
| 61 | Romania | 13,053 | 21,579,201 | 0.70 | 475 |
| 62 | Lebanon | 2,076 | 5,053,624 | 5.60 | 464 |
| 63 | Montenegro | 316 | 621,556 | 2.50 | 432 |
| 64 | Dominica | 37 | 72,680 | 2.90 | 416 |
| 65 | Bulgaria | 3,441 | 7,112,641 | 1.73 | 410 |
| 66 | United Arab Emirates | 3,858 | 9,577,128 | 2.30 | 358 |
| 67 | Uruguay | 1,208 | 3,429,997 | 4.39 | 354 |
| 68 | Macedonia | 814 | 2,109,251 | 3.01 | 347 |
| 69 | Barbados | 128 | 287,482 | 0.83 | 341 |
| 70 | Russian Federation | 57,881 | 142,098,141 | 0.36 | 312 |
| 71 | Jordan | 2,313 | 7,689,760 | 5.45 | 338 |
| 72 | Oman | 1,461 | 4,157,783 | 3.56 | 335 |
| 73 | Brazil | 61,122 | 203,657,210 | 3.70 | 332 |
| 74 | French Polynesia | 122 | 282,764 | 0.11 | 319 |
| 75 | Kuwait | 1,327 | 3,583,399 | 1.84 | 311 |
| 76 | Iraq | 1,793 | 35,766,702 | 27.77 | 295 |
| 77 | South Africa | 17,409 | 53,491,333 | 2.03 | 292 |
| 78 | Argentina | 11,815 | 42,154,914 | 2.17 | 253 |
| 79 | Bahrain | 344 | 1,359,726 | 5.20 | 252 |
| 80 | Georgia | 1,067 | 4,304,540 | 4.28 | 246 |
| 81 | Armenia | 953 | 2,989,467 | -0.14 | 232 |
| 82 | Andorra | 24 | 80,950 | -0.26 | 216 |
| 83 | Fiji | 231 | 892,727 | 1.95 | 212 |
| 84 | Trinidad and Tobago | 285 | 1,346,697 | 5.03 | 207 |
| 85 | Egypt | 14,800 | 84,705,681 | 4.49 | 198 |
| 86 | Cuba | 1,760 | 11,248,783 | 6.76 | 191 |
| 87 | Bosnia and Herzegovina | 756 | 3,819,684 | 2.95 | 177 |
| 88 | Thailand | 11,632 | 67,400,746 | 3.39 | 174 |
| 89 | Guam | 36 | 169,885 | 3.00 | 174 |
| 90 | Colombia | 7,500 | 49,529,208 | 4.28 | 163 |
| 91 | Belarus | 1,554 | 9,259,666 | 3.78 | 163 |
| 92 | India | 123,206 | 1,282,390,303 | 7.08 | 162 |
| 93 | Azerbaijan | 676 | 9,612,580 | 17.29 | 160 |
| 94 | Botswana | 410 | 2,056,370 | 1.11 | 157 |
| 95 | Panama | 485 | 3,987,866 | 8.46 | 151 |
| 96 | Tuvalu | 2 | 9,916 | 2.01 | 150 |
| 97 | Mauritius | 208 | 1,253,581 | 3.57 | 148 |
| 98 | Kazakhstan | 2,062 | 16,770,447 | 5.95 | 142 |
| 99 | Libya | 352 | 6,317,080 | 21.21 | 142 |
| 100 | Costa Rica | 720 | 5,001,657 | 3.88 | 137 |
| 101 | Cayman Islands | 11 | 59,967 | -0.20 | 134 |
| 102 | Morocco | 4,079 | 33,955,157 | 5.00 | 134 |
| 103 | Ukraine | 8,868 | 44,646,131 | -1.35 | 129 |
| 104 | Algeria | 5,171 | 40,633,464 | 3.75 | 129 |
| 105 | Puerto Rico | 660 | 3,680,058 | -0.79 | 125 |
| 106 | Namibia | 286 | 2,392,370 | 6.15 | 125 |
| 107 | Albania | 406 | 3,196,981 | 4.32 | 121 |
| 108 | Bhutan | 82 | 776,461 | 10.04 | 121 |
| 109 | Mongolia | 298 | 2,923,050 | 8.01 | 118 |
| 110 | Vanuatu | 34 | 263,888 | 4.84 | 112 |
| 111 | Palestine (West Bank & Gaza) | 475 | 4,548,815 | 6.18 | 112 |
| 112 | Mexico | 18,417 | 125,235,587 | 0.21 | 110 |
| 113 | Marshall Islands | 7 | 52,993 | 0.88 | 99 |
| 114 | Nigeria | 5,112 | 183,523,432 | 18.20 | 97 |
| 115 | Ecuador | 1,418 | 16,225,691 | 4.25 | 88 |
| 116 | Bahamas | 46 | 387,549 | -0.39 | 86 |
| 117 | Federated States of Micronesia | 12 | 104,460 | -0.51 | 83 |
| 118 | Moldova | 348 | 3,436,828 | 1.71 | 82 |
| 119 | Antigua and Barbuda | 10 | 91,822 | 0.67 | 81 |
| 120 | Ghana | 1,531 | 26,984,328 | 8.97 | 81 |
| 121 | Aruba | 12 | 103,889 | -2.26 | 80 |
| 122 | Gabon | 174 | 1,751,199 | 1.72 | 80 |
| 123 | Jamaica | 305 | 2,813,276 | -0.77 | 76 |
| 124 | Congo | 388 | 4,671,142 | 3.59 | 76 |
| 125 | Belize | 32 | 347,598 | 2.69 | 74 |
| 126 | Swaziland | 106 | 1,285,519 | 2.38 | 68 |
| 127 | Sri Lanka | 1,255 | 21,611,842 | 6.27 | 67 |
| 128 | Pakistan | 10,962 | 188,144,040 | 4.64 | 66 |
| 129 | Cape Verde | 35 | 508,315 | 6.95 | 65 |
| 130 | Solomon Islands | 43 | 584,482 | 4.10 | 63 |
| 131 | Gambia | 157 | 1,970,081 | 1.36 | 63 |
| 132 | Peru | 1,813 | 31,161,167 | 5.10 | 63 |
| 133 | Suriname | 38 | 548,456 | 5.38 | 62 |
| 134 | Venezuela | 1,473 | 31,292,702 | 7.55 | 60 |
| 135 | Maldives | 22 | 357,981 | 7.57 | 57 |
| 136 | Viet Nam | 4,092 | 93,386,630 | 6.40 | 55 |
| 137 | Samoa | 13 | 193,228 | 0.76 | 50 |
| 138 | Kenya | 2,215 | 46,748,617 | 4.32 | 49 |
| 139 | Tonga | 7 | 106,379 | -0.20 | 48 |
| 140 | Saint Lucia | 11 | 184,937 | 3.25 | 47 |
| 141 | Cameroon | 1,116 | 23,393,129 | 4.09 | 47 |
| 142 | Senegal | 691 | 14,967,446 | 4.22 | 45 |
| 143 | Uganda | 1,270 | 40,141,262 | 7.03 | 38 |
| 144 | Laos | 226 | 7,019,652 | 7.81 | 36 |
| 145 | Benin | 409 | 10,879,828 | 4.30 | 36 |
| 146 | Kiribati | 5 | 105,555 | 1.51 | 36 |
| 147 | Guyana | 34 | 807,611 | 2.53 | 34 |
| 148 | Nepal | 922 | 28,440,629 | 4.73 | 33 |
| 149 | Malawi | 519 | 17,308,685 | 5.75 | 32 |
| 150 | Zambia | 432 | 15,519,604 | 6.76 | 31 |
| 151 | Burkina Faso | 508 | 17,914,625 | 5.81 | 30 |
| 152 | Indonesia | 6,280 | 255,708,785 | 5.49 | 29 |
| 153 | Ethiopia | 1,691 | 98,942,102 | 11.11 | 29 |
| 154 | Tanzania | 1,261 | 52,290,796 | 6.56 | 28 |
| 155 | Saint Vincent and the Grenadines | 4 | 109,374 | 2.15 | 28 |
| 156 | Bolivia | 290 | 11,024,522 | 5.08 | 26 |
| 157 | Rwanda | 278 | 12,428,005 | 7.92 | 26 |
| 158 | Paraguay | 182 | 7,032,942 | 5.04 | 25 |
| 159 | Kyrgyzstan | 142 | 5,707,529 | 5.23 | 24 |
| 160 | Syrian Arab Republic | 502 | 22,264,996 | 5.07 | 23 |
| 161 | Equatorial Guinea | 17 | 799,372 | 12.91 | 23 |
| 162 | Zimbabwe | 552 | 15,046,102 | -2.88 | 23 |
| 163 | Bangladesh | 3,011 | 160,411,249 | 6.06 | 22 |
| 164 | Cambodia | 317 | 15,677,059 | 6.67 | 22 |
| 165 | Philippines | 2,091 | 101,802,706 | 4.39 | 21 |
| 166 | Papua New Guinea | 156 | 7,631,819 | 6.48 | 21 |
| 167 | Togo | 156 | 7,170,797 | 3.56 | 19 |
| 168 | Lesotho | 43 | 2,120,116 | 5.09 | 18 |
| 169 | Uzbekistan | 426 | 29,709,932 | 8.46 | 18 |
| 170 | Sierra Leone | 112 | 6,318,575 | 6.20 | 17 |
| 171 | Guinea-Bissau | 37 | 1,787,793 | 3.77 | 17 |
| 172 | Timor-Leste | 23 | 1,172,668 | 4.25 | 16 |
| 173 | Niger | 169 | 19,268,380 | 18.20 | 16 |
| 174 | Côte d’Ivoire | 386 | 21,295,284 | 3.16 | 16 |
| 175 | El Salvador | 135 | 6,426,002 | 0.39 | 16 |
| 176 | Sudan | 597 | 39,613,217 | 4.66 | 15 |
| 177 | Guatemala | 243 | 16,255,094 | 3.42 | 13 |
| 178 | Mali | 239 | 16,258,587 | 3.18 | 13 |
| 179 | Mozambique | 299 | 27,121,827 | 8.06 | 13 |
| 180 | Nicaragua | 100 | 6,256,510 | 1.74 | 13 |
| 181 | Tajikistan | 107 | 8,610,384 | 7.05 | 13 |
| 182 | Liberia | 63 | 4,503,439 | 4.92 | 13 |
| 183 | Djibouti | 13 | 899,658 | 4.59 | 12 |
| 184 | Yemen | 297 | 25,535,086 | 4.38 | 11 |
| 185 | Dominican Republic | 116 | 10,652,135 | 5.81 | 11 |
| 186 | Madagascar | 278 | 24,235,390 | 1.56 | 9 |
| 187 | Honduras | 92 | 8,423,917 | 2.07 | 9 |
| 188 | Mauritania | 35 | 4,080,224 | 8.92 | 9 |
| 189 | Comoros | 8 | 770,058 | 1.95 | 8 |
| 190 | Haïti | 112 | 10,603,731 | 0.01 | 8 |
| 191 | Sao Tome and Principe | 2 | 202,781 | 6.19 | 8 |
| 192 | Central African Republic | 41 | 4,803,082 | 3.45 | 7 |
| 193 | Guinea | 106 | 12,347,766 | 2.35 | 7 |
| 194 | Angola | 83 | 22,819,926 | 12.50 | 5 |
| 195 | Myanmar | 181 | 54,164,262 | 10.42 | 4 |
| 196 | Chad | 38 | 13,605,625 | 16.86 | 4 |
| 197 | Eritrea | 29 | 6,737,634 | 3.86 | 4 |
| 198 | Burundi | 42 | 10,812,619 | 1.42 | 3 |
| 199 | Afghanistan | 74 | 32,006,788 | 11.27 | 3 |
| 200 | North Korea | 52 | 25,155,326 | 1.85 | 2 |
| 201 | Turkmenistan | 9 | 5,373,487 | 9.85 | 2 |
| 202 | Democratic Republic of the Congo | 75 | 71,246,355 | 5.92 | 1 |
The economic growth rate data comes from my essay The 12-Year Min-Max Average. Please see this essay for technical details on how the numbers were calculated.
Only “citable” scientific documents are counted, citable documents are generally higher in quality and more important than non-citable ones. However, citable and no-citable documents tend to rise and fall together, so that including non-citable documents shouldn’t have a significant effect on the HQI numbers.
Population data comes the United Nations and the World Bank. Scientific output data from SCIMago. Economic growth data from the World Bank and Trading Economics.
* A country’s GDP growth rate could be said to somewhat take into account its population growth, since when all other things are equal, growth in population results in economic growth. However, this will only apply to a stagnant economy whose only increase or decrease is a result of population change rather than
Footnotes
- Kanazawa, S. (2003). Why productivity fades with age: The crime–genius connection. Journal of Research in Personality, 37(4), 257-272.
- See my essay The Gene-Culture.
- Cochran, G., Hardy, J., & Harpending, H. (2005). Natural History Of Ashkenazi Intelligence. Journal of Biosocial Science, 38(05), 659.
- See my essay The 12-Year Min-Max Average: A Simple Method for Calculating Real, Legitimate Economic Growth and Canceling Out Central Bank Manipulations and other Noise
Massively oversimplified model that doesn’t take into account poverty, starvation, lack of access to education, foreign investment and intervention, the effects of war and conflict etc. Also you demonstrate that this HQI measurement can change drastically over time, which makes it practically useless as a tool for predicting the future success of a nation. Since the two factors you use to calculate HQI are scientific paper output and real economic growth, HQI doesn’t tell us anything at all; it’s only a measure of the current rate of development of a nation that tells us nothing about why scientific productivity is at the level at which it is or why the economic growth rate is where it is. Additionally, I contest the claim that the greatest predictor of success is the average quality of a population, where quality is measured in terms of the level of intellectual and physical prowess of the individual. You need to do a careful meta-analysis to find out whether or not this is true, but in my opinion the way to predict a nation’s trajectory is to look at the intersection of all factors rather than any individual predictor. Intelligence, virility and morality certainly play a role, but a population need not necessarily be exceedingly intelligent or moral or physically fit on average in order to enjoy economic and military success. Nice try but I think it’s time to go back to the drawing board.