11 Islamic articles on: science metrics

Science in the Islamic world grew at the fastest rate in 2018

The Scimago Journal & Country Rank numbers for 2018 are in and they show tremendous growth among some of the the 11 top scientific publishers among the Muslim-majority countries. The increase in the number of scientific papers published in 2018 was 44,616, which is almost twice the highest growth recorded over the past 22 years.

Iran continues to be the top scientific publisher in the Islamic world, followed by Turkey and Indonesia. The numbers do not include the scientific output of India’s 200 million Muslims.

The greatest growth came from Indonesia, which went from 18683 papers in 2017 to 31708 papers in 2018 (an increase of 13025 papers). The second highest growth came from Egypt (+5016 papers), and the third highest from Iraq (+4087).

The Islamic world is now publishing more science than either Germany, France or the United Kingdom. If the rate of growth over the past 10 years is maintained, the Islamic world will surpass the United States by 2036 assuming there is no significant growth among these Western countries (which is a reasonable assumption).

Of course, the quality of the papers published by Muslim countries is not as high as those published in more advanced countries, but that too should be expected to improve over time.

Source for the data: The Scimago Journal & Country Rank

The incredible growth of science in the Muslim world: The scientific output of Muslim countries in 2017

See the 2018 update: Science in the Islamic world grew at the fastest rate in 2018

The scientific output of Muslim-majority countries has grown tremendously over the past 20 years, measured in the number of scientific and scholarly papers published in international journals. The top scientific publisher is Iran, followed by Turkey, followed by Malaysia:

The scientific output of the top 10 Muslim-majority population countries according to SJR (citable documents alone)

Below is the total of the scientific output of all ten countries:

The data only includes citable papers published in peer-reviewed journals included in the Scopus database (source: Scimago Journal & Country Rank).

In just ten years, these Muslim countries went from publishing 64110 papers in 2007 to 211287 papers in 2017, growing by over three times.

Below is a comparison of the Muslim total (blue) with the established scientific powers France, Germany, the United Kingdom and the United States:

The Muslim total has surpassed all of the European powers in quantity (not in quality, of course).

If the Muslim countries maintain their growth rate of 7.7% annually (the average rate of the past 5 years), they will surpass the United States by 2030:

It seems unlikely that that kind of growth can be sustained. The image below is more likely, which assumes an increase of 14000 papers per year (the average annual increase over the past 5 years). Accordingly, the Muslim countries will reach the level of the United States by 2042:

It should be noted that these statistics do not take account of the 200 million Muslims of India and their scientific output.

How backward is Russia compared to Europe and the United States and when will it catch up?

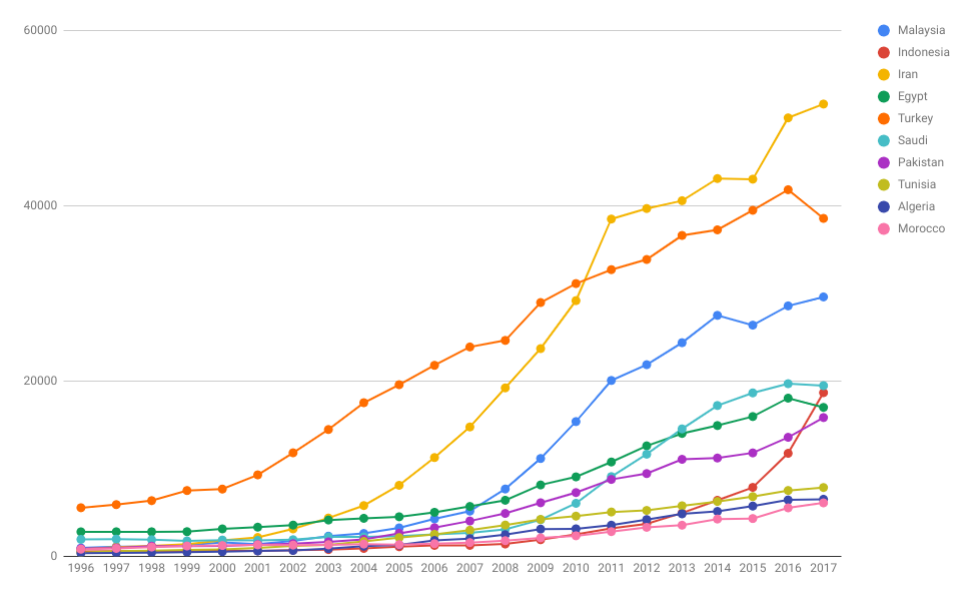
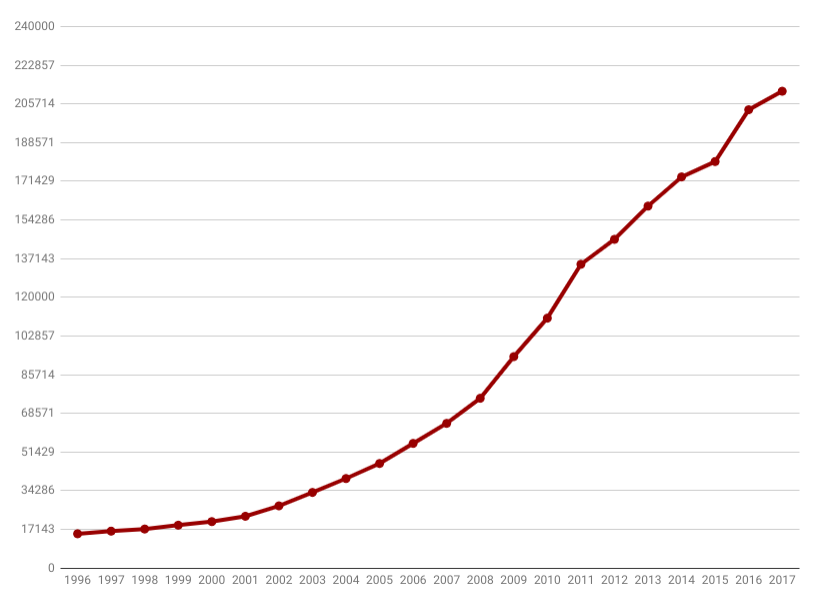
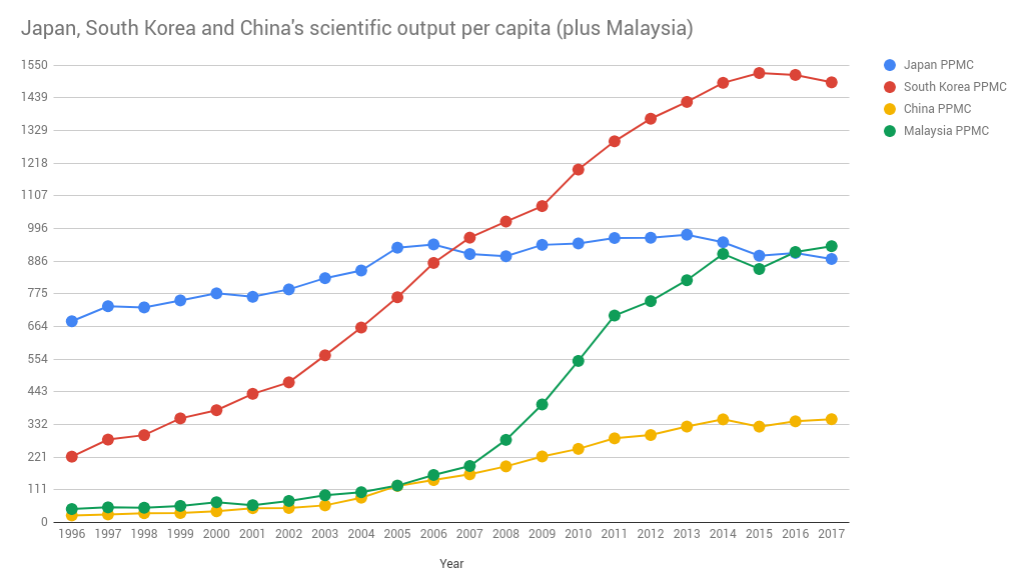
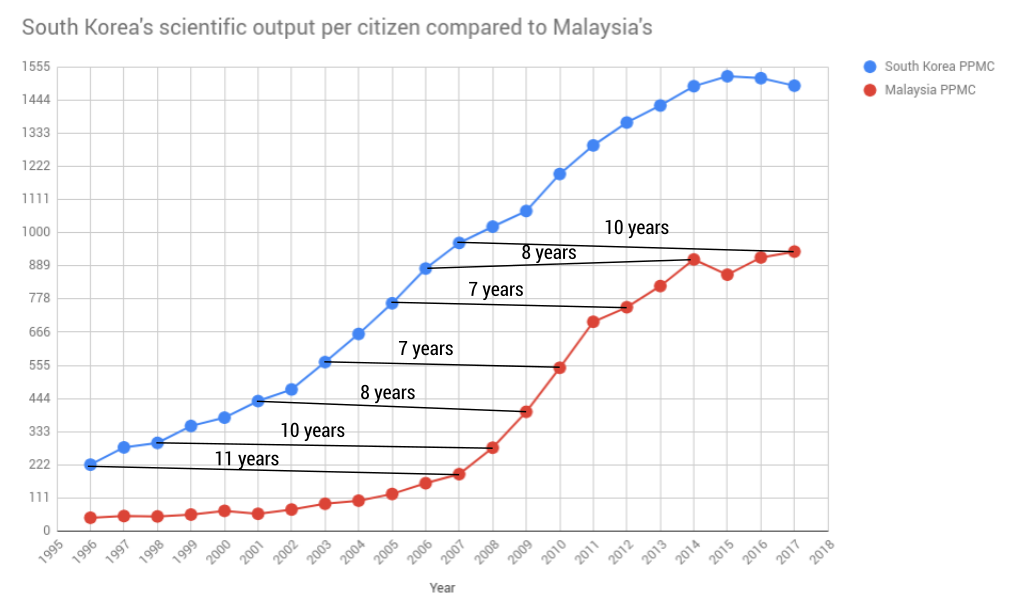
Below is a chart of the scientific output productivity of a number of important countries. Scientific output productivity refers to the number of scientific research papers published by a certain country divided by its population. A higher number indicates that the country is more “scientifically productive”, meaning that it is prosperous and advanced enough to have a large number of citizens busy doing scientific and scholarly research. In 2017, Russia’s scientific output per capita was 561. It published 80796 scientific papers and had a population of 143.9 million. Dividing the two numbers, we get 561, the number of scientific papers published by the country per million citizens. In 2008, Russia published 36419 papers. Ten years later its output had more than doubled, reflecting the fact it is investing heavily in science and has many more professors and researchers busy doing research at universities and research institutions. Still, its output per citizen is still below Iran, and it is almost half of Malaysia. Russia’s scientific output is almost exactly one third of the US, which stands at 1684 papers per million citizens.

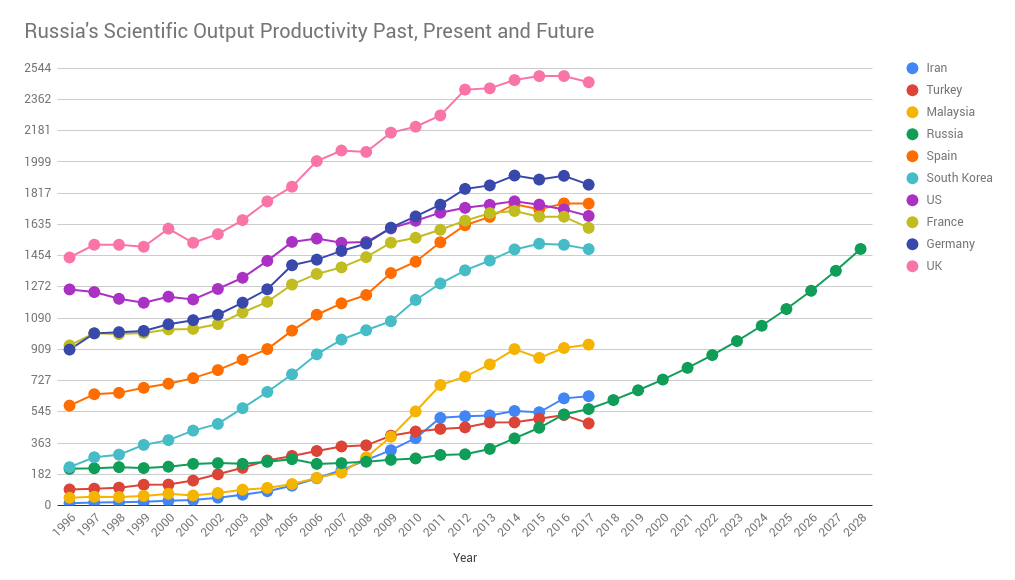
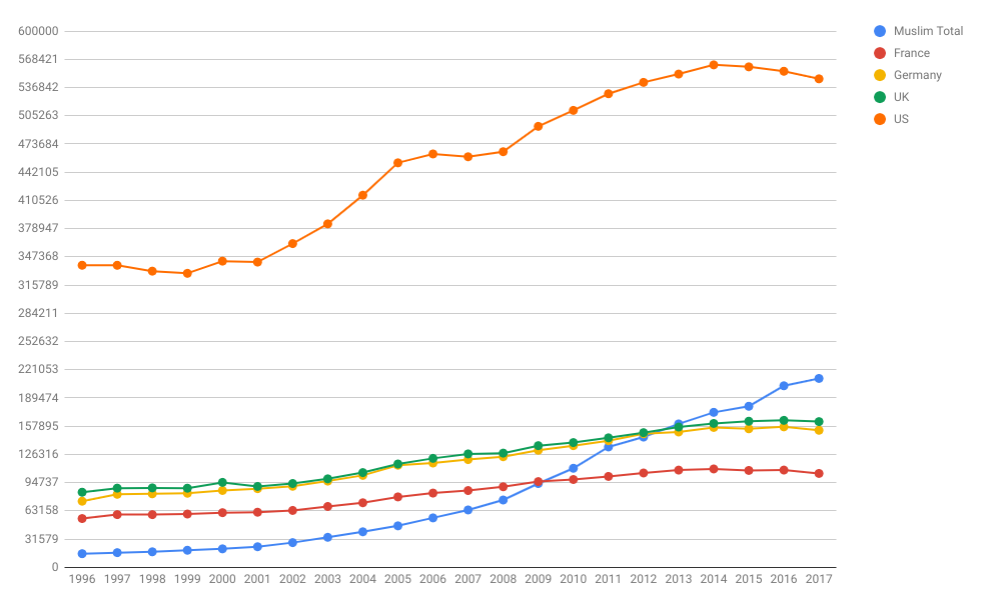
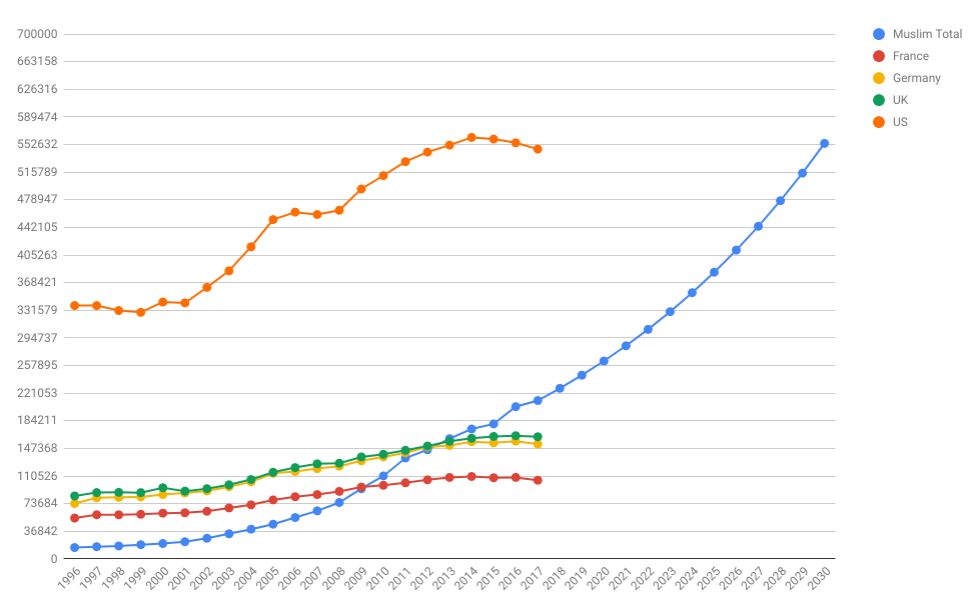
The scientific output of the US peaked in 2014 and has only declined since. This is likely a trend that will continue. Russia, in the meantime, will likely continue growing barring a nuclear war, so that by 2028 it will likely reach South Korea’s output level, and soon after that of France (whose output is also declining). The forecast above assumes a 9.35% annual growth in scientific output for Russia, which is what its annual growth was between 2008 and 2017, so I am assuming a continuation of the same trend now since the Russian rulers appear to have finally realized the crucial importance of scientific research for national power and prestige and will likely continue investing  heavily in it.

We can expect the scientific output of the United States and Europe to stagnate and decline due to their aging native populations. Immigrants can help stave off some of the fall in output, but due to their generally lower educational attainment, it is unlikely that they will be able to undo the trend unless the countries only allow in highly educated immigrants.

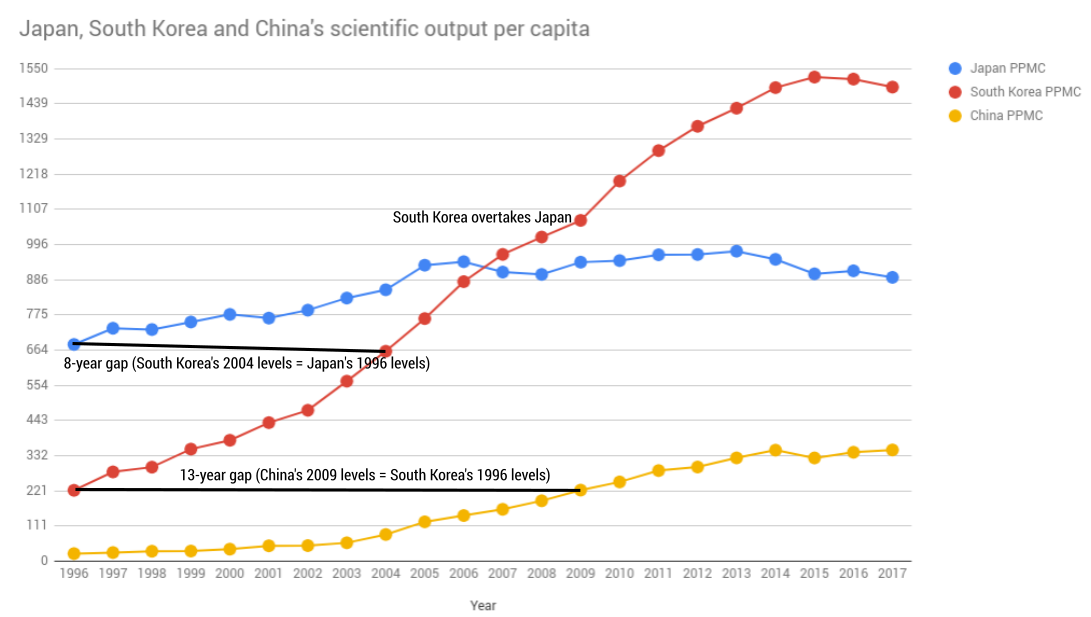
Russia’s 2017 output was where Spain was in 1996 and where South Korea was 2003. We can expect Russia to reach European levels of scientific output by 2028.

Spain: It is interesting to note that Spain is today publishing more science per capita than either the United States or France, despite its population having a median age five years higher than that of the US and two years higher than that of France.

The United Kingdom: The UK’s scientific output is amazing. It publishes almost 1000 more papers per million citizens than many other European countries, reflecting an extremely well-funded and well-organized post-graduate system.

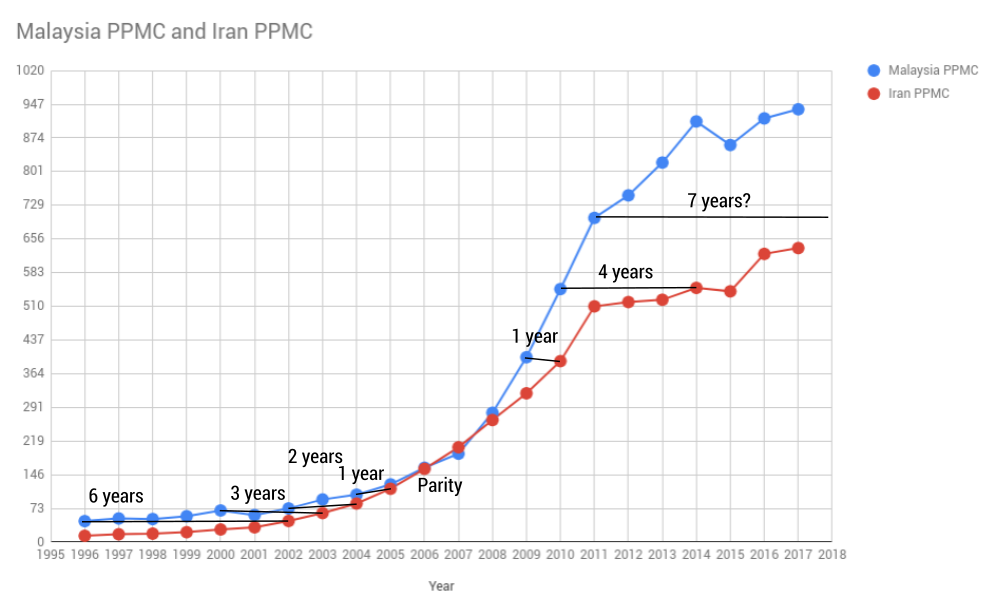
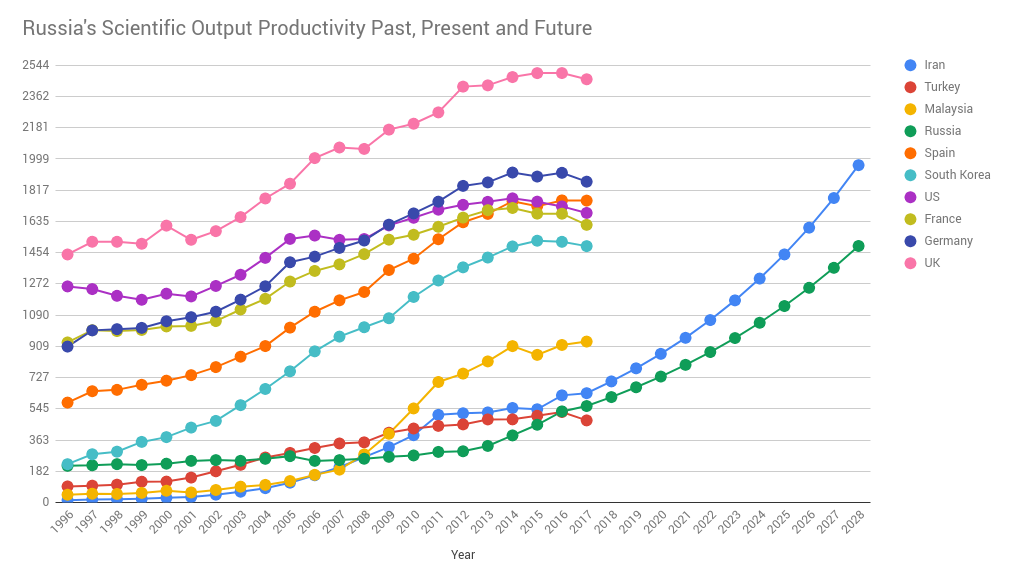
Below is a similar forecast done for Iran. If Iran continues at the rate of scientific output growth it had from 2008 to 2017, it will reach European output levels by 2028. I expect it to slow down its growth and to closely track that of Russia, perhaps being somewhere slightly below it by 2028.

Data from the United Nations and Scimago.

Malaysia has overtaken Japan in scientific research output per capita

Below is the graph from my previous post where I discovered that Malaysia has been producing more scientific research per citizen than Japan since 2016. This is very interesting because Malaysia is a Muslim-majority country. Japan has stagnated since 2006 due to its aging population and stagnant economy while Malaysia, thanks to having a sustainable population (thanks to sustainable fertility rates, thanks in large part to religious faith) continues to grow steadily. We can expect South Korea to slowly fall as it goes the way of Japan, so that Malaysia may actually become the top science-producing country (per capita) of Asia in the next two decades.

In 2017, Japan published 892 scientific papers per million citizens, while Malaysia produced 936.


Data from the United Nations and Scimago.

Japan, South Korea and China’s scientific research output compared

As part of my series of posts comparing the scientific output per capita of different countries, in this post I will compare Japan, South Korea and China’s scientific output per capita, meaning the number of scientific research papers published per million citizens by each country. In the late 1990’s South Korea was going through industrialization but was greatly behind Japan. South Korea’s papers published per million citizens (PPMC) was 222.8 in 1996, compared to Japan’s 681, meaning that Japan was producing almost three times as much scientific research as South Korea. As South Korea industrialized, the gap between the two countries narrowed, so that South Korea actually overtook Japan in 2007. The sad story of Japan is that it has never been able to go significantly above its 2006 scientific output levels of 942 PPMC, perhaps due to its aging population (its median age is higher by 6 years today compared to South Korea’s), and perhaps due to its stagnant economy caused by the long-term effects of interest.

South Korea too appears to have entered the twilight zone in 2015 at a PPMC of 1523, we can probably safely assume that it will go through decades of slow decline from here on (unless immigration saves the day). China is slowly ramping up its scientific output, although it has yet to overtake South Korea’s scientific output per capita levels for the year 1999.

Adding Malaysia to the chart lead to something I hadn’t noticed before, Malaysia overtook Japan in scientific output per capita in 2016 (the green line):

Data from the United Nations and Scimago.

China’s scientific output per capita compared to Malaysia’s

As part of my series of posts comparing the scientific output per capita of different countries, in this post I will compare Malaysia and China. Malaysia is interesting for being the most industrialized Muslim-majority country in the world. It took China until 2001 to reach Malaysia’s scientific output per capita levels for 1996, meaning that China was five years behind Malaysia on this measure of scientific output. By 2005, the two countries were producing the same amount of scientific research per citizen. Then the gap started widening, so that it took until 2011 for China to reach Malaysia’s output levels for 2008. But even by 2017, China had not caught up to Malaysia’s 2009 output levels. Today Malaysia is producing almost three times as much scientific research per citizen than China is. I expect China to remain firmly 10 years or more behind Malaysia for the foreseeable future due to the time and energy costs of scaling scientific research output over the vast swaths of China, but China will likely ultimately catch up with Malaysia some day.

Note that China was producing 16 times as much scientific research as Malaysia in 2017, what we are comparing here is output per citizen, which tells us the entire country’s general state of development. Since China has highly undeveloped rural areas with hundreds of millions of citizens, those are going to seriously drag down its output per citizen until those areas are finally industrialized.

Data from the United Nations and Scimago.

South Korea and Malaysia’s scientific output growth compared

As part of my series of posts comparing the scientific output per capita of different countries, in this post I will compare South Korea and Malaysia. This is an interesting comparison because South Korea is one of the most recently industrialized parts of Asia, while Malaysia is the most industrialized Muslim-majority country in the world. In 1996, Malayisa was 11 years behind South Korea in scientific output per capita (how many scientific papers it published per million citizens). This scientific productivity gap narrowed to seven years between 2003 and 2005, then it started widening again, so that in 2017 it was more than 10 years. Now that South Korea’s output is declining, Malaysia might be expected to slowly catch up with it in the next decade.

Data from the United Nations and Scimago.

Malaysia and Iran’s scientific growth compared

In the previous posts I compared South Korea’s scientific output per capita with China’s, then with Iran’s. In this post, I will compare Iran and Malaysia, to see how far behind Iran is compared to Malaysia. It took Iran until 2003 to reach the same scientific output level as Malaysia had in 1996, meaning that it was 6 years behind. But by 2006 Iran had achieved parity with Malaysia, both countries were publishing the same amount of scientific research per capita. But the two countries started diverging in 2008, with Malaysia far outpacing Iran’s growth (perhaps due to the sanctions on Iran reducing its ability to fund research). It took Iran until 2014 to reach Malaysia’s level of 2010. As late as 2017, Iran had not reached Malaysia’s levels of 2011. Besides sanctions, another reason might be Iran’s much larger geographical size making scaling scientific research costlier in time and money, as is also the case in China.

Data from the United Nations and Scimago.

Comparing Iran’s scientific growth to South Korea’s

In the previous post I compared China’s scientific growth to South Korea’s. In this post I do the same for Iran. Iran’s gap with South Korea is narrower than China’s gap. In 2017 it was only 13 years behind South Korea when it came to scientific research output per capita. This gap might continue growing due to Iran being larger and more difficult to industrialize. But now that South Korea’s per-citizen scientific output is in decline, Iran (and China) have a good chance of catching up with it within the next decade.

Data from the United Nations and Scimago.

Comparing China’s scientific output to South Korea’s

It has been said that China is twenty years behind South Korea in development, and that South Korea is or was twenty years behind Japan. A measure of development that I like to use for comparing the development level of different countries is PPMC, which stands for Papers Published Per Million Citizens, referring to the number of scientific and scholarly papers a country publishes per a million citizens in a year. In 2017, that number was 1491 for South Korea while it was 349 for China, meaning that South Korea produced more than four times more scientific research per capita than China, which means that South Korea’s infrastructure, institutions and educational attainment on average are four times more advanced than China’s. The reason for this is that besides the fact that China started industrializing later than South Korea, China is a much larger country and requires far more investment and work to where South Korea is. China’s coastal cities likely already far outpace South Korea technologically, but China’s interior is going to be dragging down the country’s averages for decades to come.

Below we have South Korea’s scientific output per capita compared to China’s. It took China until 2009 to reach the same scientific output per capita as South Korea had in 1996, meaning that on this measure China was 13 years behind South Korea. This lag only increased with time, so that by 2014 the gap was 15 years. By 2018, the gap was 18 years because China’s output per capita hadn’t risen significantly.

It is natural for this gap to grow with time because due to China’s much larger size, it is going to take it far more time to raise the country’s scientific production compared to the much smaller South Korea. The good news for China is that this gap is probably not going to be getting much larger because South Korea’s output has started falling (likely due to an aging population, i.e. fewer young people available to become scientists and scholars) while China’s continues to rise.

Data from the United Nations and Scimago.

Indonesia’s unlocked scientific potential?

The Scimago Journal & Country Rank is one of the things I look forward to most to seeing every year. The rankings show each country’s scientific output, a very important measure of a country’s present level of development and its speed of development. The biggest surprise in the 2017 rankings was from Indonesia, whose cited paper count jumped from 11,765 in 2016 to 18,683 in 2017:

Source: Scimago Journal & Country Rank

In 2016, Indonesia was number 45 on world rankings for scientific output. Thanks to the 2017 jump, in 2017 it was number 35.

Indonesia has been a great laggard in scientific output due to its lack of development. Its papers per million capita (PPMC) is 71 compared to Malaysia’s 925. Only 16 years before 2017, in 2002, Malaysia’s PPMC was 72, comparable to Indonesia today. If Indonesia follows the same development trajectory as Malaysia (the way South Korea followed Japan), by 2032 Indonesia will be one of the world’s top scientific powerhouses. Due to Indonesia’s vastness compared to Malaysia, their development will likely take longer; however, the availability of newer and cheaper technologies may speed development up so that they end up following Malaysia’s trajectory despite their handicaps.

If Indonesia ever catches up to Malaysia’s present level of scientific output, it would be publishing 241,000 papers per year, making it the world’s third largest science hub after the US and China.

Almost all of the world’s countries are seeing a great increase in scientific output, caused by adopting Western methods of scientific research and publishing. Pakistan’s output doubled between 2010 and 2017. Egypt did similarly. Iran publishes more papers per capita than Russia. I believe we are in for some very interesting times.