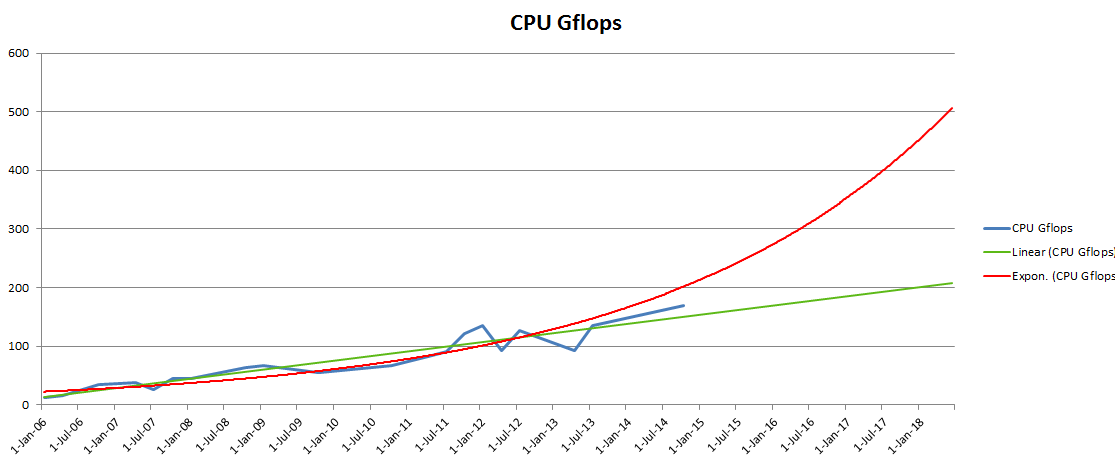
In Q1 2006, the fastest, most expensive CPU could do 12.421 GFLOPS on the Whetstone test. In Q4 2014, the fastest consumer CPU (Intel Core i7-5960X) can do 169.79 GFLOPS.
I added two trend lines to the chart. The green one is a linear trend line, showing that in January 2018 we will have a 200 GFLOPS CPU, which doesn’t sound like much, while the red exponential trend line promises 500 GFLOPS during the same period. The truth will likely be somewhere in between.
The latest CPU’s gains come from its 8 cores, therefore a better performance chart would only show single-thread improvements, since single-thread shows the true performance improvement per core and is a big bottleneck for many games and applications.
A quick single-thread comparison can be done between the Intel Core 2 Extreme X7900 (Q3 2007), which received a single-thread score of 968 on the PassMark test, and the Intel Core i7-2600K (Q1 2011), which received almost exactly double the single-threaded performance at 1943. It took Intel less than 4 years to double the performance of its highest-end consumer CPU. But three years later, the fastest CPU in single-threaded tests is the Intel Core i7-4790K with a score of 2532, meaning that in about four years Intel has only managed to gain a 30% performance improvement in single-threaded applications.
This is a big deal and shows the performance stagnation that gamers and professionals have been complaining about in recent years. If the next four years end up like the past four, in 2018 the fastest consumer CPU will only be 30% faster if no additional cores are added. The interpretation of Moore’s Law that promised a doubling of performance every 18 months has long been inaccurate.
Below is the data that I based the chart on the top on, taken from CPU reviews that featured the SiSoft Sandra Whetstone test.
 Quarter        GFLOPS
 10-Jan-06	12.421
 10-Apr-06	15.703
 10-Oct-06	33.797
 10-Apr-07	37.693
 10-Jul-07	26.7
 10-Oct-07	44.4
 10-Jan-08	44.2
 10-Oct-08	62.879
 10-Jan-09	66.5
 10-Oct-09	55.9
 10-Oct-10	67
 10-Apr-11	83
 10-Jul-11	91
 10-Oct-11	121
 10-Jan-12	136
 10-Apr-12	93.2
 10-Jul-12	126
 10-Apr-13	93
 10-Jul-13	135.4
 10-Oct-14	169.79


Hi! how did you computed GFLOPS!
Hi,
Some CPU reviews show results for the SiSoft Sandra Whetstone test, which gives a number in GFLOPS.