Author Archives: Ikram Hawramani

Ikram Hawramani

About Ikram Hawramani

The creator of IslamicArtDB.

The 12-Year Min-Max Average: A Simple Method for Calculating Real, Legitimate Economic Growth and Canceling Out Central Bank Manipulations and other Noise

Introduction

Real economic growth is different from the increase in GDP that comes from monetary expansion. The 12-year min-max method that I have come up with is a way of calculating a country’s GDP growth rate over a 12-year period that aims to cancel out “fake” growth caused by monetary expansion and boom-bust cycles by taking recent economic crashes into account.

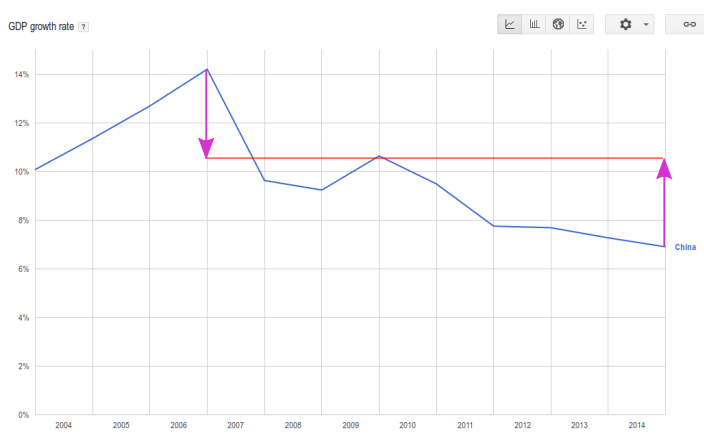
To find out China’s real economic growth from 2004 to 2015 (inclusive), find the year with the highest economic growth and the year with the lowest economic growth over the 12 year period, then average the two numbers. Over the 2004-2015 period, China’s highest economic growth was 14.7%, in 2007. Her lowest economic growth was 6.9%, in 2015. To find her real economic growth:

14.7 + 6.9
__________ = 10.8
    2

China’s GDP in 2004 was $1.9417 trillion. According to the above calculation, her economy grew at an annual rate of 10.8%, meaning that in 2015, her true GDP would be $5.999 trillion.

According to the above, China’s real economy in 2015 was three times as large as its 2004 economy. This finding is remarkably close to the 3.3 times growth of GDP from 2004 to 2015 predicted by PPP calculations ($5.7 trillion to 19.4 trillion).

Since the dollar is not a reliable store of value, the $5.999 trillion number for 2015 doesn’t mean much of anything, unless we compare it to the 2004 number of $1.94. The result, as mentioned, is that the 2015 number is three times larger, meaning the 2015 economy was three times as large as it used to be in 2004.

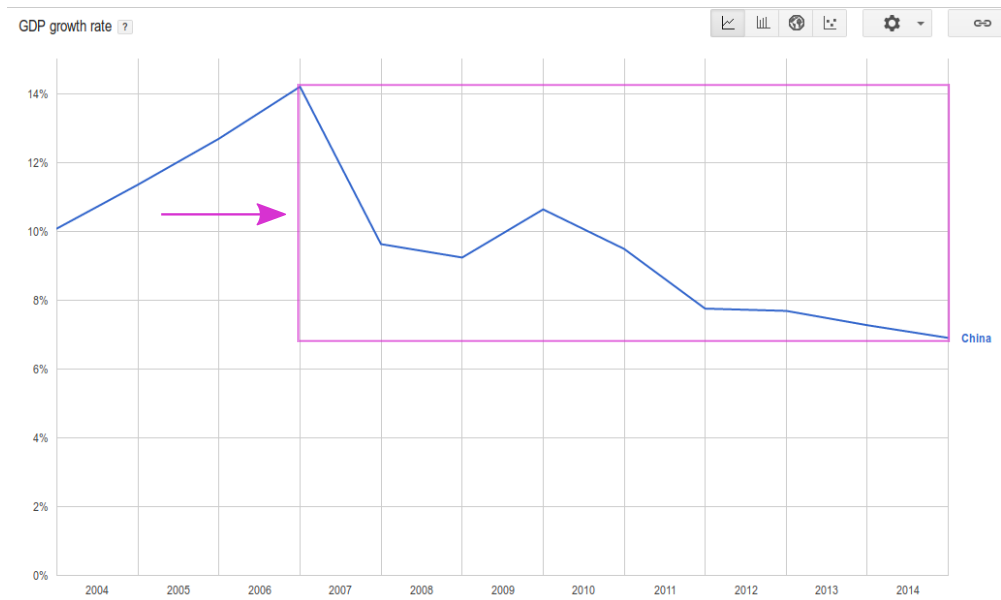
Another way of thinking of the above graph is to draw a rectangle with the country’s highest and lowest economic growth rates at opposing corners, then taking the midpoint of the height of the rectangle:

Extending the calculation to other countries, I will start with India:

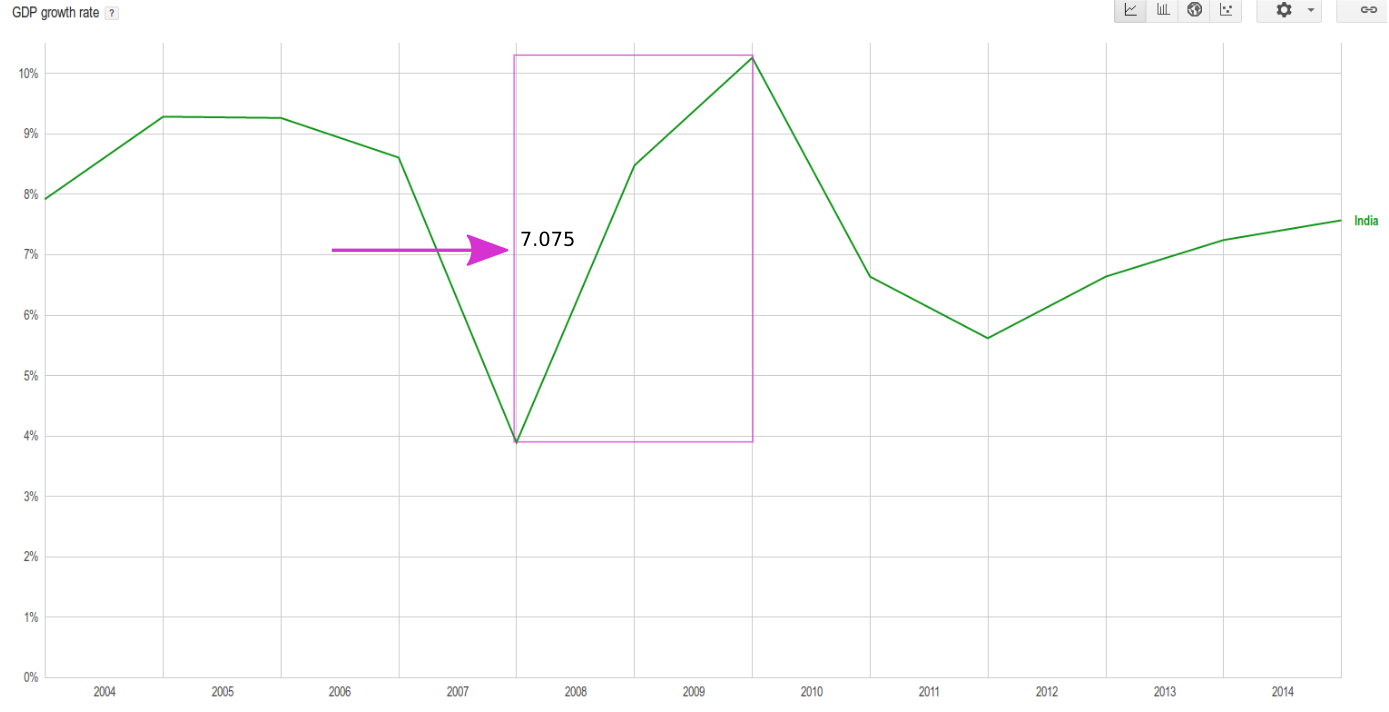
Over the 2004-2015 period, India’s lowest growth rate was in 2008 at 3.89%. Its highest growth was in 2010 at 10.26%. Averaging the two results in 7.075%.

In 2004, India’s GDP was $0.7215 trillion. An annual growth rate of 7.075% results in a 2015 real GDP of $1.53 trillion, meaning its economy grew by a factor of 2.12. Both nominal and PPP calculations say its economy grew by a factor of 2.7. The 2.12 is quite believable to me, the truth probably lies somewhere in between.

Moving on to the United State:

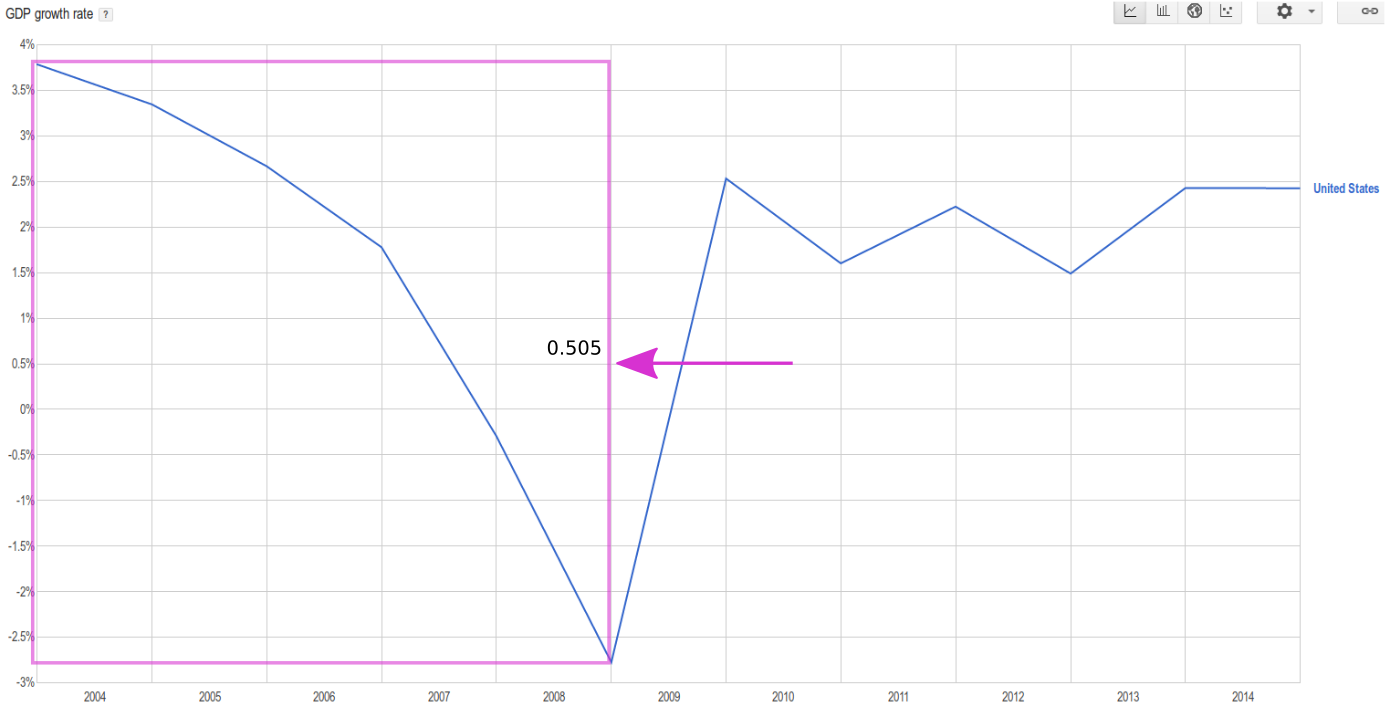
America’s highest GDP growth was in 2004, at 3.79%. Its lowest growth was in 2009, at -2.78%. Averaging the two, the result is a miserable annual growth rate of half of a percent. America’s GDP in 2004 was $12.27 trillion. According to this calculation, its real 2015 GDP was $12.97 trillion, which fits the feelings of America’s population. America’s 2015 economy was only 5% larger than its 2004 economy from an honest, Smithian point of view. During the same period, its population grew 9.77% larger, meaning the wealth or income of America’s average citizen actually fell during the period. The pie grew by 5%, the pie eaters grew by 9.77%.

Predictably, Japan is even more of a trainwreck than the United States.

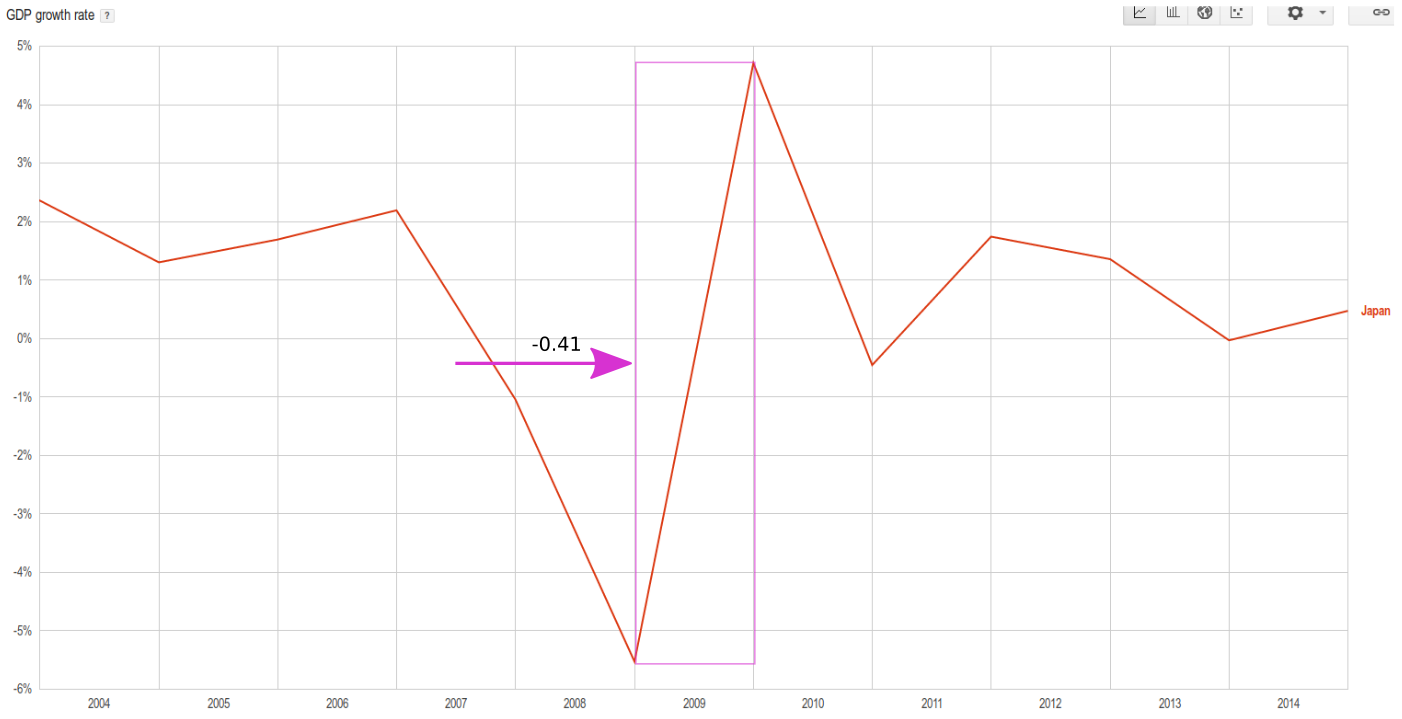
Over the 2004-2015 period, Japan’s high point of growth was in 2010 at 4.71%. Its low point was in 2009, at -5.53%. Averaging the two, the result is an annual growth rate of -0.41%, meaning its economy actually shrunk by that amount every year. This is well in keeping with a stagnant economy and an aging and shrinking population count. Japan’s GDP in 2004 was $4.65 trillion. According to this economic shrink rate, Japan’s GDP in 2015 was $4.45 trillion, 4.3% smaller than in 2004.

Why 12 Years

The average length of a central-bank induced asset bubble cycle is 8 years (think the late 2000 and 2008 crashes). 12 years is a cycle and a half. The 2004 to 2015 window, as an example, captures the recovery from the last crash, and our current “recovery”, providing a rich picture of what brought us here. If we look at two cycles (2000-2015 inclusive), the data will be skewed by the previous cycle’s peak, which is quite irrelevant today. If we look at only one cycle (2008-2015), we will lose historical context that is still relevant today (the period that lead to the 2008 crash).

A market cycle and a half makes for a relevant and informative picture of most periods of a country’s economic history. The idea of using a market cycle and a half comes from John P. Hussman, manager of the billion-dollar Hussman Funds mutual fund.

Why It Works

The 12-year min-max average takes a realistic look at the “fakeness” factor within an economy and takes it out. It shows how much of an economy is a house of cards built on debt and investor euphoria, and how much of it is real and of lasting value.

The basic idea is that it measures the psychology of an economy’s participants. Crashes happen when a very large number of investors realize it wasn’t such a smart idea to buy those overpriced assets, thinking that they would be able to sell them for even higher. This moment of realization happened in 1929, 2000 and 2008.

After a crash, central banks use monetary easing to motivate investors to bid up the prices of assets. This creates a growing atmosphere of euphoria that increases spending in the economy and creates years of apparent growth. When the next crash inevitably comes, the atmosphere changes from one of euphoria to one of fear and panic. The market sobers up. In this year of sobriety, investors often underestimate the market’s worth. This acts as an antidote to the overestimation of the market during euphoric years. This is what happened in March 2009.

The momentum of an economy that’s truly expanding cannot be reversed by a financial crisis. It can slow a little, but it will continue growing, as China, India and Bangladesh’s numbers show. When we average out the years of most euphoria and least euphoria in a fast-growing economy, we still get a high rate of growth, because the growth is real, it is not entirely based on the feelings of investors.

But how does investor feeling affect GDP? The blaze of euphoria caused by monetary easing and fanned by complicit mass media makes it easier, and more likely, for businesses to borrow and expand their activities, regardless of supply-and-demand considerations. Overvalued corporations find it easy to convince lenders to give them large loans. The wealthy from around the country open their wallets and outbid each other in investing their wealth in all kinds of business activities in fear of being left behind.

In stagnant economies (where standards of living for the average citizen are no longer improving appreciably) like the those of the US, Japan and Western Europe, it is by and large the feelings of investors that drive economic expansion and recession.

Measuring Crashiness

One obvious difficulty with choosing only two points on a 12-year growth graph is that growth is cumulative. A 3% growth at the beginning of the period could mean a trillion dollars increase, while at the end of the period it could mean two or three trillions.

Regardless of where the low point is on the graph, it shows that it is possible, within that economy, to lose this much value. It shows that a great amount of volatility exists within the economy, so that even if in recent years the growth numbers have all been great, if there is one big crash year on the 12-year graph, it tells us that a similar crash is in the future.

The cumulative effect doesn’t take away from the idea, the idea contains it within itself. No matter how much growth we’ve had in recent years, a crash can take most of it away, as it is farther in the future, so that its percentage effect is going to be larger than the effect of the growth of the previous years.

The PPP GDP per capita of the United States over the 12-year period  (denominated in 2005 international dollars) illustrates this. In 2004 it was $48,597. Five years of “growth” later, it was $48,557 in the 2009 crash. The crash easily outweighed all the previous years of growth. In 2015, the number had grown to $52,549, and the coming crash can easily take it back close to square one again.

The 12-year min-max average shows the “crashiness” of an economy. And since there is always a bigger crash in the future, measuring a country’s greatest year of growth against its worst year of growth makes a lot sense.

Honesty requires that I admit I came up with these reasonings for why the 12-year min-max average works after I had discovered it. I needed a reliable way of comparing the true economic momentums of different countries for the HQI, the Human Genetic-Cultural Quality Index that I will announce later, and among the methods I tried out, this one brilliantly fit the true states of many economies I have studied.

List of Countries by Real 12-Year Annual GDP Growth

Below is a list of 203 sovereign states along with their real economic growth from 2004 to 2015 according to the 12-year min-max average. The countries are sorted by population.

The number I’m most skeptical of is Germany’s. Germany has appeared to grow fast in recent years. The 12-year min-max average says its growth has actually been negative 0.77% (i.e. that the next crash will wipe out all of its recent growth). This is possible, and only history will tell.

Russia gets a 0.36% growth rate. I expect its rate will be shown to be quite higher after the next crash, as it puts the 2008 crash behind, and what remains will be its recent real economic growth rate that cannot be wiped out by a crash.

Please see the fine print at the end of the table regarding certain corrections I’ve made.

Country Population Real 12-Year Annual GDP Growth Rate (2004-2015)
China 1,401,586,609 10.545
India 1,282,390,303 7.075
United States 325,127,634 0.505
Indonesia 255,708,785 5.49
Brazil 203,657,210 3.7
Pakistan 188,144,040 4.64
Nigeria 183,523,432 18.195
Bangladesh 160,411,249 6.055
Russian Federation 142,098,141 0.36
Japan 126,818,019 -0.41
Mexico 125,235,587 0.205
Philippines 101,802,706 4.39
Ethiopia 98,942,102 11.11
Viet Nam 93,386,630 6.4
Egypt 84,705,681 4.485
Germany 82,562,004 -0.77
Iran 79,476,308 5.02
Turkey 76,690,509 2.265
Democratic Republic of the Congo 71,246,355 5.915
Thailand 67,400,746 3.385
France 64,982,894 -0.075
United Kingdom 63,843,856 -0.595
Italy 61,142,221 -1.735
Myanmar 54,164,262 10.415
South Africa 53,491,333 2.025
Tanzania 52,290,796 6.56
South Korea 49,750,234 3.605
Colombia 49,529,208 4.275
Spain 47,199,069 0.3
Kenya 46,748,617 4.315
Ukraine 44,646,131 -1.35
Argentina 42,154,914 2.17
Algeria 40,633,464 3.75
Uganda 40,141,262 7.025
Sudan 39,613,217 4.655
Poland 38,221,584 4.23
Canada 35,871,283 0.13
Iraq 35,766,702 27.77
Morocco 33,955,157 4.995
Afghanistan 32,006,788 11.27
Venezuela 31,292,702 7.545
Peru 31,161,167 5.095
Malaysia 30,651,176 2.95
Saudi Arabia 29,897,741 5.895
Uzbekistan 29,709,932 8.46
Nepal 28,440,629 4.73
Mozambique 27,121,827 8.06
Ghana 26,984,328 8.965
Yemen 25,535,086 4.38
North Korea 25,155,326 1.85
Madagascar 24,235,390 1.56
Australia 23,923,101 2.985
Cameroon 23,393,129 4.085
Taiwan 23,381,038 4.53
Angola 22,819,926 12.5
Syrian Arab Republic 22,264,996 5.065
Sri Lanka 21,611,842 6.27
Romania 21,579,201 0.695
Côte d’Ivoire 21,295,284 3.16
Niger 19,268,380 18.195
Chile 17,924,062 2.5
Burkina Faso 17,914,625 5.81
Malawi 17,308,685 5.745
Netherlands 16,844,195 -0.035
Kazakhstan 16,770,447 5.95
Mali 16,258,587 3.18
Guatemala 16,255,094 3.415
Ecuador 16,225,691 4.25
Cambodia 15,677,059 6.67
Zambia 15,519,604 6.76
Zimbabwe 15,046,102 -2.88
Senegal 14,967,446 4.22
Chad 13,605,625 16.855
Rwanda 12,428,005 7.92
Guinea 12,347,766 2.35
Cuba 11,248,783 6.76
Tunisia 11,235,248 2.165
Belgium 11,183,411 0.675
Greece 11,125,833 -1.67
Bolivia 11,024,522 5.08
Benin 10,879,828 4.295
Burundi 10,812,619 1.42
Czech Republic 10,777,060 1.02
Dominican Republic 10,652,135 5.805
Portugal 10,610,014 -0.77
Haïti 10,603,731 0.01
Hungary 9,911,396 -0.81
Sweden 9,693,883 0.405
Azerbaijan 9,612,580 17.285
United Arab Emirates 9,577,128 2.3
Serbia 9,424,030 2.965
Belarus 9,259,666 3.78
Tajikistan 8,610,384 7.05
Austria 8,557,761 -0.09
Honduras 8,423,917 2.07
Switzerland 8,238,610 1.005
Israel 7,919,528 3.705
Jordan 7,689,760 5.45
Papua New Guinea 7,631,819 6.48
Hong Kong 7,313,557 3.12
Togo 7,170,797 3.56
Bulgaria 7,112,641 1.73
Paraguay 7,032,942 5.035
Laos 7,019,652 7.81
Eritrea 6,737,634 3.855
El Salvador 6,426,002 0.39
Sierra Leone 6,318,575 6.195
Libya 6,317,080 21.205
Nicaragua 6,256,510 1.735
Kyrgyzstan 5,707,529 5.225
Denmark 5,661,723 -0.645
Singapore 5,618,866 7.32
Finland 5,460,592 -1.545
Slovakia 5,457,889 2.67
Turkmenistan 5,373,487 9.85
Norway 5,142,842 1.17
Lebanon 5,053,624 5.6
Costa Rica 5,001,657 3.88
Central African Republic 4,803,082 3.45
Ireland 4,726,856 1.085
Congo 4,671,142 3.585
New Zealand 4,596,396 1.25
Palestine (West Bank & Gaza) 4,548,815 6.175
Liberia 4,503,439 4.915
Georgia 4,304,540 4.28
Croatia 4,255,374 -1.115
Oman 4,157,783 3.555
Mauritania 4,080,224 8.915
Panama 3,987,866 8.46
Bosnia and Herzegovina 3,819,684 2.945
Puerto Rico 3,680,058 -0.785
Kuwait 3,583,399 1.84
Moldova 3,436,828 1.705
Uruguay 3,429,997 4.39
Albania 3,196,981 4.32
Lithuania 2,998,969 -1.86
Armenia 2,989,467 -0.14
Mongolia 2,923,050 8.01
Jamaica 2,813,276 -0.765
Namibia 2,392,370 6.15
Qatar 2,350,549 14.875
Lesotho 2,120,116 5.09
Macedonia 2,109,251 3.005
Slovenia 2,079,085 -0.43
Botswana 2,056,370 1.105
Latvia 2,031,361 -1.225
Gambia 1,970,081 1.36
Guinea-Bissau 1,787,793 3.765
Gabon 1,751,199 1.715
Bahrain 1,359,726 5.195
Trinidad and Tobago 1,346,697 5.025
Swaziland 1,285,519 2.375
Estonia 1,280,227 -2.225
Mauritius 1,253,581 3.565
Timor-Leste 1,172,668 4.245
Cyprus 1,164,695 -0.505
Djibouti 899,658 4.585
Fiji 892,727 1.945
Guyana 807,611 2.53
Equatorial Guinea 799,372 12.905
Bhutan 776,461 10.035
Comoros 770,058 1.95
Montenegro 621,556 2.5
Solomon Islands 584,482 4.1
Macao 584,420 3.2
Suriname 548,456 5.38
Luxembourg 543,261 1.51
Cape Verde 508,315 6.95
Malta 431,239 0.75
Brunei Darussalam 428,539 1.03
Bahamas 387,549 -0.39
Maldives 357,981 7.57
Belize 347,598 2.69
Iceland 336,728 2.405
Barbados 287,482 0.825
French Polynesia 282,764 0.11
Vanuatu 263,888 4.84
New Caledonia 263,147 3.75
Sao Tome and Principe 202,781 6.185
Samoa 193,228 0.755
Saint Lucia 184,937 3.25
Guam 169,885 3
Saint Vincent and the Grenadines 109,374 2.145
Grenada 106,694 3.33
Tonga 106,379 -0.2
Kiribati 105,555 1.505
Federated States of Micronesia 104,460 -0.505
Aruba 103,889 -2.26
Seychelles 93,754 3.785
Antigua and Barbuda 91,822 0.67
Andorra 80,950 -0.26
Dominica 72,680 2.895
Bermuda 65,578 0.13
Cayman Islands 59,967 -0.2
Greenland 57,275 0.05
Saint Kitts and Nevis 55,376 1.83
Marshall Islands 52,993 0.875
Monaco 38,320 1.64
Liechtenstein 37,461 -0.4
San Marino 31,802 3.255
Palau 21,291 -0.22
Tuvalu 9,916 2.01

For Iran, ignored the 2012 crash, as it was a political event. Used the 2008 crash instead, as it was a shared world event. For Brazil too due to 2015. For Iraq 2014 due to CIA-ISIS. For Venezuela, 2009 was used due to recent mismanagement. For Syria, 3.23 lowest growth from 2010 was used, due to start of the Syria v. CIA war in 2011. For Yemen, ignored numbers from 2011 due to the crisis, used lowest number from 2006.

Data for New Caledonia taken from Trading Economics (World Bank data missing).

Monaco’s highest growth rate taken from World Bank (14.58 for 2007). Lowest number (-11.3 for 2009) missing from World Bank, taken from Trading Economics.

Data for Greenland after 2009 is missing. Used 2009 number as lowest growth rate (-5.41), and 2007 number as highest growth rate (5.51).

No reliable annual growth data for French Polynesia. Assumed a top growth of 4.42 and a bottom growth of -4.2, as hinted at by the CIA World Factbook.

For Sierra Leone, ignored 2013 and 2015 numbers, as they were aberrations caused by the mining sector’s boom and collapse.

For Liechtenstein, top and bottom growth numbers were taken from Trading Economics as World Bank seemed inaccurate and missed the years after 2009.

Guadelope, Cook Islands, Montserrat, Netherlands Antilles, Anguilla, Martinique, Réunion, Gibraltar, American Samoa, US and British Virgin Islands, Northern Mariana Islands and French Guiana not included as GDP growth rate is not. It is possible that the World Bank counts them toward their parent states, couldn’t verify this.

Faroe Islands not included as GDP growth rate data is unavailable.

Data for North Korea, Guam and Cayman Islands’ GDP growth rate taken from Trading Economics as World Bank doesn’t provide them.

For the Central African Republic, numbers after 2012 are ignored due to the civil war there. Used 2004’s GDP growth rate as the top number (5.99) and 2005 as the bottom (0.91).

For Eritrea, ignored 2008 GDP growth low as it was caused by US sanctions. Used 2006 low instead (-0.97).

Somalia is not included in the World Bank data, and other available data is none too reliable due to the fact that the country is a war zone. Decided not to include the country as no useful conclusions can be drawn from the data.

No reliable data found for Turks and Caicos Islands, Wallis and Futuna, Nauru, Mayotte, and Western Sahara, so omitted them.

The calm before the 2017/18 crash

John Hussman’s latest Weekly Market Comment starts with these foreboding quotes:

“No Congress of the United States ever assembled, on surveying the State of the Union, has met with a more pleasant prospect than that which appears at the present time.”
- Calvin Coolidge, December 4, 1928

“There can be little argument that the American economy as it stands at the beginning of a new century has never exhibited so remarkable a prosperity for at least the majority of Americans.”
- Alan Greenspan, January 30, 2000

“We believe the effect of the troubles in the subprime sector on the broader housing market will be limited and we do not expect significant spillovers from the subprime market to the rest of the economy or to the financial system.”
- Ben Bernanke, May 17, 2007

“Investors haven’t been this optimistic on the global economy since 2011... A full 23 percent of investors expect an outright ‘boom,’ according to a survey released Tuesday by Bank of America Merrill Lynch... ‘The U.S. economy is not only humming on all cylinders, but in our view the optimism associated with a clean sweep by the Republicans in Washington is likely to create a self-fulfilling period of strong markets and at least the potential for strong growth.’ The optimism comes amid forecasts global growth will pick up and as Donald Trump promises to cut taxes, boost fiscal spending and loosen regulations in moves that could boost corporate earnings. ‘Macro optimism is surging,’ wrote the team.”
- Bloomberg, February 14, 2017

Recovering from a SAXParseException error with no data loss

I was working on a book I’m writing in LibreOffice Writer. I am using the docx format for the book, as I plan to finish its formatting in Microsoft Word, not knowing that LibreOffice Writer has a tendency to corrupt docx files. After closing and opening the file again, I received the following error:

I extracted the docx file (which is just a zip file, on Windows you can rename it to something.zip to extract or, while Ubuntu Linux allows you to extract it without renaming it). Found the document.xml file and opened it in VIM. I used the following command to jump to position 791513 on line 2:

791513l

That is the position number followed by a lowercase L.

I don’t see any error there, so LibreOffice Writer is not telling the truth, the error is not there. I opened document.xml in Chromium, but it reported the same wrong error position. Since the error message I received was saying the “w:cstheme” attribute was redefined, I decided to use regular expressions to search for it. I spent a stressful hour trying to learn VIM’s ridiculous regular expression syntax, but couldn’t figure it out.

In the end, I decided to use egrep instead. I ran the following command on the command line, which looks for a “w:cstheme” attribute that is not separated by a forward slash from antoher “w:cstheme” attribute, meaning it will find tags that have duplicate “w:cstheme” attributes, which is the error that LibreOffice Writer is reporting:

egrep "w:cstheme[^/]*w:cstheme" document.xml

And voila! It highlighted the error:

I copied the highlighted text (using ctrl+shift+c), opened document.xml again in VIM, and pasted the text in VIM’s seach bar (first press forward slash to open the search bar, then ctrl+shift+v to paste):

Pressing enter twice, it jumped right to the line and position (“column”) where the error was, which was actually position 817157:

If you understand html/xml, you will see the issue. To correct it, change this:

<w:rFonts w:eastAsia="Times New Roman" w:cs="Times New Roman" w:cstheme="majorBidi" w:ascii="Times New Roman" w:hAnsi="Times New Roman" w:cstheme="majorBidi"/>

To this, removing one of the unnecessary ‘w:cstheme=”majorbidi”‘ attributes:
<w:rFonts w:eastAsia="Times New Roman" w:cs="Times New Roman" w:cstheme="majorBidi" w:ascii="Times New Roman" w:hAnsi="Times New Roman" />

I searched again for the error in VIM, to make sure there were no repeated errors. I fixed multiple other occurrences of the error until I couldn’t find any more. Now, when opening the document.xml in Chromium, no error was reported:

This was a good sign. I made the mistake of compressing the parent folder of the document, renaming it to docx, and trying to open it. LibreOffice Writer said the document was corrupted and offered to fix it. It tried but failed. After a long time, I realized my error. I shouldn’t have compressed the parent folder, I should have compressed the files and folders inside the parent folder directly, as follows:

Above I have selected the files and folders that make up the docx document. I then right-clicked it and chose “Compress”, and chose the “zip” option. Below is the compressed file:

Next, I renamed the file to “occupy.docx_FILES.docx”:

Then I opened the file in LibreOffice Writer, and it worked!

To prevent this in the future, I will save the file in the ODF Text Document format (.odt), which is the native format used by LibreOffice that supposedly doesn’t suffer from this issue. Once the book is done, I will then save it as docx for use in Microsoft Word.

Charting the Strauss-Howe Generational Theory in 2017

Below is a chart (click it to zoom) that shows the seasonality of Anglo-American history since the end of the Middle Ages, according to the Strauss-Howe Generational Theory (as described in their 1997 book The Fourth Turning). Click here to download an enlarged version.

Below is the inner circles zoomed in (for those who don’t want to click the above chart to zoom in):

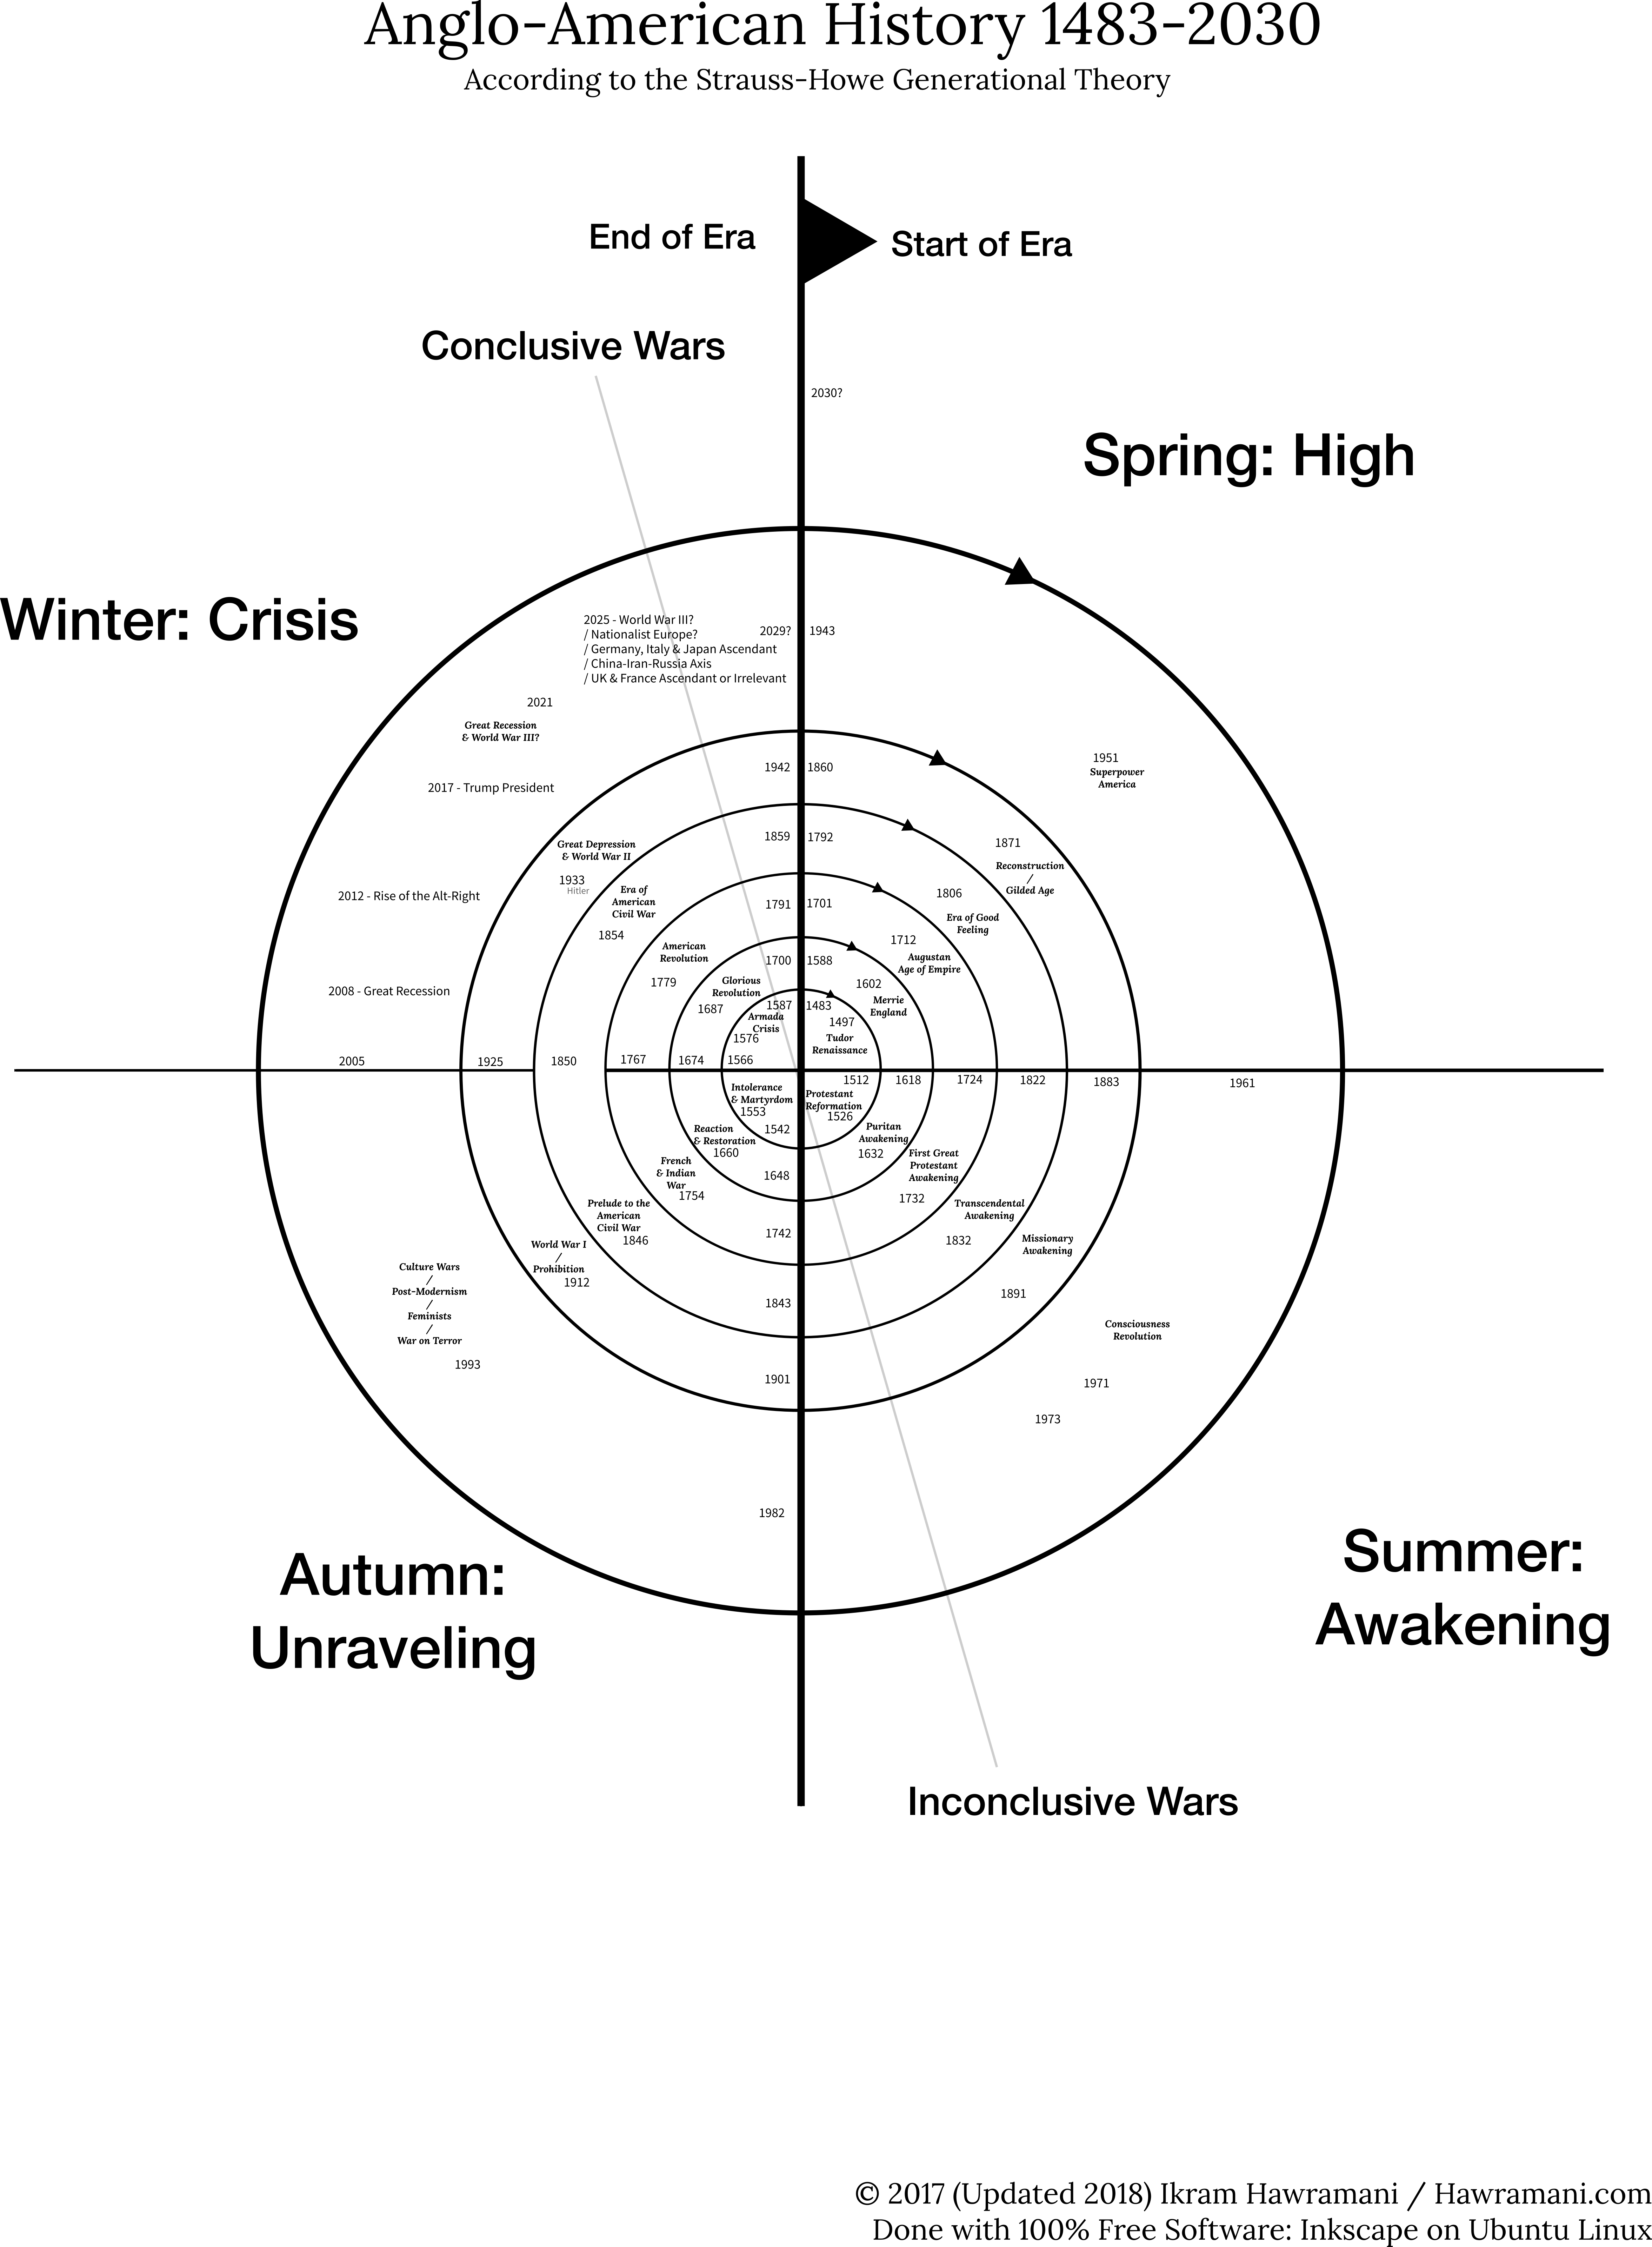
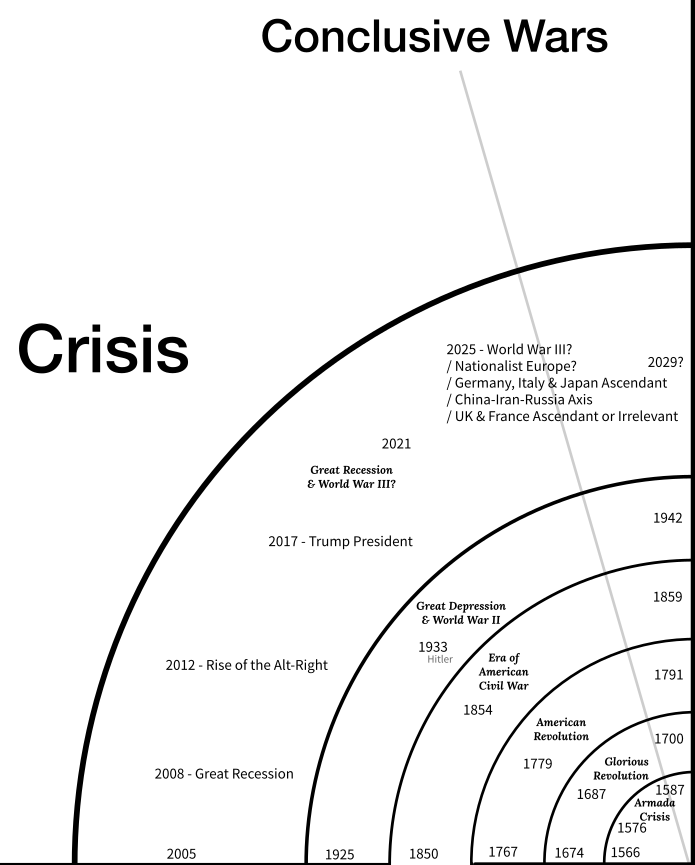
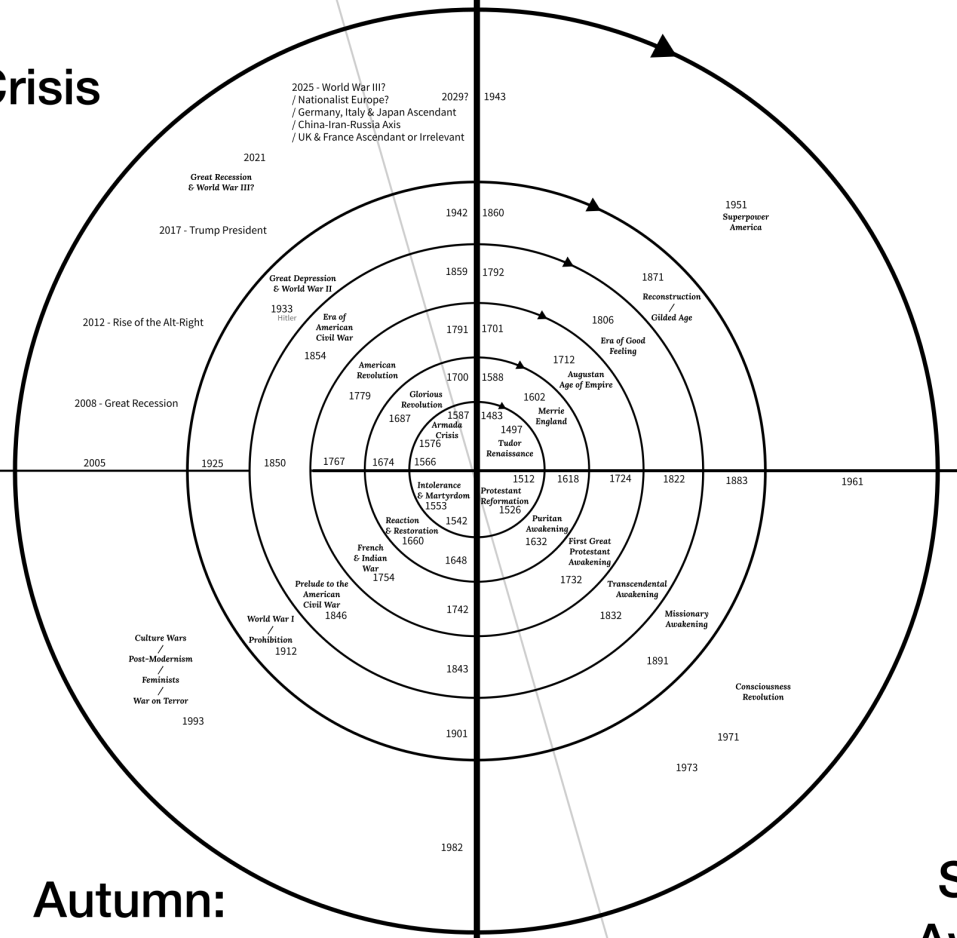
The “saeculum” is the word that Strauss-Howe use for each circle of the chart above, four seasons together make one saeculum. A saeculum is generally the length of one human life time, and its regularity has been noted since ancient times. We are currently living at the end of the saeculum that started in 1943, and which will probably end sometime between 2025 and 2035.

Below is the part of the chart that is most relevant to 2017. Many world leaders feel that we are approaching a major war. Countries are preparing for war, with Russia and China at the forefront, and Japan starting its own re-militarization program. According to the Strauss-Howe theory, 2017 is equivalent to 1933 (when Hitler got in charge and started rebuilding Germany’s army), 1854 (when the prospect of an American Civil War felt more and more imminent), and 1779 (the middle of the American Revolutionary War against Britain, and the year of the French Revolution). Needless to say, right now we are living in very interesting times.

[I updated these charts in 2018.]

Fixing jagged/aliased text on KDP/createSpace paperback covers

Upon publishing my new book, Object-Oriented PHP Best Practices, as an Amazon paperback, I was dismayed to see how ugly the cover looked on their site:

I had provided the book’s cover as a PDF saved from Photoshop. I realized that the issue was that Amazon’s software had trouble properly rasterizing the text in the PDF. For this reason, I went back to Photoshop, went to Layer -> Flatten Image to rasterize the image, then saved that as a separate PSD file (since you will lose all layers in the image, making the cover’s text impossible to edit in the future), and then from there saved it as a PDF. I uploaded the new cover to KDP, and a day or two later, I checked the paperback’s page and was happy to see that it looks good now:

Setting the default search path for Catfish File Search

The Problem

It was surprisingly difficult to find out how to set a default search path for Catfish. On the command line, you can simply do this to always make Catfish search from the root directory:

alias catfish='/usr/bin/catfish --path=\/'

But adding this line to your ~/.bashrc file will not affect the default search path for Catfish unless you launch it from the command line. What I wanted was to be able to click on the Catfish icon on the Unity launcher and have it launch in my root directory (so that it would search all my hard drives). Typically for a Linux program, Catfish’s settings do not offer a way to set this.

The Solution

The solution is to open up the file /usr/share/applications/catfish.desktop as root, for example by typing this on the command line:

gksudo gedit /usr/share/applications/catfish.desktop

Once the file opens up, change the Exec line near the bottom as follows, adding a --path=/some_path/ to the end of the line. Below, I’ve only put a forward slash as a path, meaning I want catfish to search everything, including all mounted hard drives.

Now, when I click the Catfish icon on the Unity launcher, the default search path is “File System”, which is how the program refers to the root directory.

When will the average flagship smartphone have a 5000 mAh battery? Probably around 2029

From 2007 to 2016, the iPhone’s battery grew from 1400 mAh in the first iPhone to 1960 mAh in the iPhone 7 (ignoring the new plus size iPhones). The energy density of lithium ion batteries grows at an exponential rate (5-8% a year), doubling every ten years, according to Tesla’s J.B. Straubel. The iPhone’s battery density growth is lagging this trend probably due to the continuous push for thinner phones.

Using Microsoft Excel’s exponential regression functionality, the following chart forecasts future iPhone battery sizes based on the available historical data, predicting that the small (non-plus) iPhone’s battery capacity will reach 5000 mAh around the year 2036:

Moving on to the more interesting new plus-sized iPhones, Excel cannot do an accurate automatic exponential regression due to the fact that there isn’t enough historical data available on the plus-sized iPhones. By examining the above chart and manually doing the regression using a second series, I found that Excel assumed an approximate rate of growth of 3.81%, and an approximate rate of growth of the rate of growth of 0.09%. Using these same rates on current iPhone Plus battery sizes, we get the following chart:

As it can be seen, around 2024 the iPhone Plus battery size reaches 4000 mAh, and around 2029 it reaches 5000 mAh. If the trend toward ever thinner phones slows, then the 5000 mAh smartphone battery might be achieved at an earlier date. I am hopeful that at least one large manufacturer is brave enough to bet on much larger batteries as a selling point, instead of following Apple’s lead in making things thinner and thinner.

When will smartphones have 1 terabyte of storage? Probably around 2021

While I’m no fan of Apple, the iPhone has so far been the leader in performance and storage. The internal storage of Apple’s latest and greatest iPhone provides a good benchmark for the current level of storage of the entire smartphone industry. When an iPhone with a new level of storage comes out, every manufacturer plays catch-up with Apple releases a flagship phone of similar storage.

Here is a chart that shows the trend in iPhone in internal storage. It extrapolates the trend into the future to predict when the iPhone will likely have one terabyte of internal storage (blue is historical storage levels, orange is predicted, and the dotted line is the trendline):

The chart assumes an exponential trend, since storage density and prices have followed an exponential increase and reduction trend.

I assumed that from 2018 through 2020, the iPhone will stay at 512 GB, similar to how it remained at 64 GB from 2011 through 2013. It is possible that instead of this, the iPhone will stay at 256 GB from 2017 through 2019. This will not significantly affect the historical trend.

Here is the same chart with the forecast extended to 2030. The trendline predicts an internal storage of 5 terabytes in 2027 and 10 terabytes in 2029.

I know that 10 terabytes in a smartphone may seem unnecessarily high. But historical trends show that every age can find good (and frivolous) uses for all the storage it can get.

Below is a table of every iPhone release date, device name, highest offered storage and battery capacity:

Release Date
Device Storage (GB)
Battery (mAh)
June 29, 2007 iPhone 1 16 1400
July 11, 2008 iPhone 3G 16 1150
June 19 2009 iPhone 3GS 32 1219
June 24, 2010 iPhone 4 32 1420
October 14, 2011 iPhone 4S 64 1432
September 21, 2012 iPhone 5 64 1440
September 20, 2013 iPhone 5S 64 1560
September 19, 2014 iPhone 6 128 1810
September 25, 2015 iPhone 6S 128 1715
September 16, 2016 iPhone 7 256 1960

How to search a document on Linux while ignoring diacritics (harakat/accents)

The Problem

Most applications are not smart enough to ignore accents when searching through the text of a document. Here is a screenshot of LibreOffice 5.2 failing at finding the word Arabic word “bsm” because I didn’t type in every single diacritic:

This is an especially serious problem when searching through Arabic text because the usage of diacritics is totally inconsistent as they are not strictly necessary. Different levels of diacritics are added according to the level of user-friendliness that is desired by the document creator.

Firefox is equally miserable at searching Arabic text:

The Solution

The solution is to open the document in a WebKit-based web browser, which has sensible handling of diacritics. Below is a screenshot of the open source Midori browser succeeding at finding and highlighting the Arabic word I was searching for even though I didn’t type in the diacritics:

Other WebKit browsers include Chromium and Chrome, both by Google. I would rather use a non-Google browser personally, so Midori is my preferred option.

If your document is not in the HTML format (the format that browsers use), you can use LibreOffice or Microsoft Word (etc.) to save it as HTML.

Fixing washed out colors in Ubuntu 16.10

How I improved the colors and brightness/contrast and the appearance of fonts on my Ubuntu 16.10 PC monitor

After moving to Ubuntu from Windows, one thing that has been constantly annoying me was the washed out/stark colors on my monitor and ugly-looking fonts in Firefox. I have spent hours fiddling with my monitor’s settings, color profiles on the Color tool, and various random font-related hacks using the terminal to no benefit.

Today I finally found the solution. It was to connect my monitor to my PC using a DVI cable instead of HDMI. Apparently there is an issue with communication between the Linux Kernel and most (if not all) monitors when they use HDMI and DisplayPort, at least this is what I understood from this discussion on Kernel.org.

One other possible solution is using this command (replace HDMI1 with the name of your display as given by the command /usr/bin/xrandr -q --prop | grep ' connected'):

xrandr --output HDMI1 --set "Broadcast RGB" "Full"

When trying the above, I kept getting this error:

BadName (named color or font does not exist)

Not wanting to spend the rest of my day troubleshooting this error, I took the brute-force approach of using a DVI cable that I fortunately had lying around in a closet.

How I solved “jQuery Ajax Uncaught TypeError: Cannot read property ‘type’ of undefined”

A solution for an error occurring during a jQuery $.ajax request.

I was using this common jQuery Ajax pattern on a page I am working:

    $(function () {
        $(document).on('click', '.create-domain .submit', function (e) {
            e.preventDefault();

            var data = {
                domain_description: $('.create-domain .domain-description-textarea')
        }

            $.ajax({
                type: 'post',
                url: '/process/something.php',
                data: data,
                error: function (data) {
                    console.debug(data);
                },
                success: function (response) {
                   //stuff
                }
            });
        });

But on clicking the submit element, I kept getting this cryptic error:

Uncaught TypeError: Cannot read property 'type' of undefined
    at r.handle (jquery-2.2.4.min.js:3)
    at e (jquery-2.2.4.min.js:4)
    at Gb (jquery-2.2.4.min.js:4)
    at Gb (jquery-2.2.4.min.js:4)
    at Gb (jquery-2.2.4.min.js:4)
    at Gb (jquery-2.2.4.min.js:4)
    at Function.n.param (jquery-2.2.4.min.js:4)
    at Function.ajax (jquery-2.2.4.min.js:4)
    at HTMLButtonElement. (something.php:575)
    at HTMLDocument.dispatch (jquery-2.2.4.min.js:3)
    at HTMLDocument.r.handle (jquery-2.2.4.min.js:3)

The problem was that in the data variable, I was including an HTML element (a textarea) inside the data variable, instead of including the textarea‘s content. Thus the corrected code is (notice the .val() at the end):

            var data = {
                domain_description: $('.create-domain .domain-description-textarea').val(),
        }

Hopefully this will help a few people, helping making the world economy more efficient by 1*10-12% (saving the world economy $107 USD over the next year).

Fixing the kworker CPU usage / ACPI errors issue on a Skylake motherboard (ASRock Z170 Pro4)

In which ASRock bricks my motherboard and a random $10 Chinese device comes to the rescue, with the help of a German gentleman

Since I no longer trust the spyware that is Windows 10, I have wanted to move my main PC (6700K CPU, R9 290 graphic card, ASRock Z170 Pro4 motherboard) to Linux for months now and finally did it yesterday. Everything worked as expected until, while working inside Ubuntu, I started getting messages that the computer was low on disk space even though I had allocated 25 gigabytes to the root partition.

Using ncdu in the terminal, I found that the log folder was taking up all the space, and found that /var/log/kern.log and /var/log/syslog were being written to at what seemed to be a rate of 1 MB/second, with endless repetitions of:

ACPI Error: Method parse/execution failed [\_GPE._L6F] (Node ...), AE_NOT_FOUND (...)

Another issue was that the kworker process was using constantly 100% of one of the eight CPU cores.

Forums suggested this was a motherboard firmware issue. So I decided to do a firmware update. My firmware was a pretty early one, something like version 1.5, while the latest available firmware is 7.3. I went to the UEFI interface and tried using the “Internet Flash” utility provided by ASRock. It successfully retrieved the fact that there was a 7.5 version update available to the firmware, but when clicking on update, it would conveniently fail to connect to the internet. Somehow the geniuses at ASRock had created software that could connect to the internet to ask if an update was available, but on downloading the update it would fail to connect to the internet. Still, I am glad that we are light years ahead of the pain, anguish and days of wasted labor that we used to suffer in the 90’s to fix a simple hardware issue.

I downloaded the BIOS binary file from the ASRock website, put it on a USB flash drive, and went to UEFI interface again, this time using the “Instant Flash” utility. The first time I tried it, the computer instantly crashed and rebooted, and nothing else happened. I tried a second time. This time it seemed to work, until the firmware update got stuck at 10%. I waited for hours to see if it would finish, but it didn’t. I left my computer on overnight, thinking that there might still be a tiny chance it would eventually finish. In the morning it hadn’t. So I hard rebooted my PC, and then nothing. It would turn on, but it wouldn’t give any output, not even the ASRock logo that shows at the beginning.

Knowing that the BIOS chip had probably become corrupted from the update and that I had probably upgraded my motherboard from an ASRock to an ASBrick, I looked to see what could be done. After yanking on the BIOS chip on the motherboard for a while, I found that it was designed to come off, so I took it out. I then learned about devices that can reflash a corrupted BIOS chip. I found out about the the Chinese device CH341A  that sells for about $10. I ordered one made by a company called SMAKN on Amazon with overnight delivery. This morning it arrived.

At first I was dismayed to see that there were three unattached pieces, I thought they might need soldiering:

But after watching this video by UltraNSC, I found that I wouldn’t be needing those pieces. I installed the software provided in the description of the video on an old but working Windows 7 laptop that I have, inserted the device, tried installing all the drivers in the file, and still the software (CH341A.exe) wouldn’t detect the device. I unplugged the device and moved to another USB port, and this time the software detected it.

The software detected that the BIOS chip had a size of 16 megabytes, similar to the binary file provided by ASRock. This was a good sign. I erased the BIOS chip with the software, then tried to open the binary file with the software but it wouldn’t detect it because the file provided by ASRock doesn’t have a filetype extension. I renamed the file to have a .bin extension, and now the software could see it. I loaded the file and clicked “Program” to write it to the chip. Everything worked without a problem. I clicked “Verify” to make absolutely sure the data was copied without error and that came out positive.

I put the BIOS chip back into the motherboard and turned the computer on. A message by American Megatrends came up, and clicking F12, it took me to the UEFI interface. I rebooted and was immediately taken into Windows as the UEFI had forgotten my preferred boot device order. Windows tried to do some sort of automatic repair then restarted the computer, at which point I went into the UEFI interface and told it to use my main SSD as the boot device. Restarting, I was taken into grub, and from there went into Ubuntu. Logging in, I saw that kworker wasn’t acting up anymore, and that the logs weren’t being flooded.

Now it is time to install Windows 7 in a networking-disabled virtual machine inside Ubuntu so that I can continue using OneNote and Photoshop without sending all my data to Microsoft. I have also kept my Windows 10 installation on another partition just in case I ever need it, for example to play Battlefield 1, though it seems I’ve become enough of an adult that video games barely interest me anymore, though I still enjoy watching Stodeh on Twitch.

Islam, the Good Parts: Guaranteed Basic Income for Women

One thing that is rarely mentioned when speaking about Islam, even among Muslims, is that Muslim women don’t have to work. They can work if they want to, but they don’t have to if they don’t want to.

Islam makes it the duty of a woman’s male relatives to take care of her financially. Men have to provide for their sisters, mothers, wives and daughters. This is not merely an act of charity that men are encouraged to do. It is their legal duty. In a devout Muslim society, no woman can ever be homeless as long as she has a self-respecting male relative.

This provides a tremendous sense of freedom for women, including single women, who want to do creative work. They can focus on doing what they like, for example growing a small business or a writing career, while enjoying freedom from the stress of having to earn a living. Instead of having to work for potentially abusive employers or customers, they will have the option of only choosing jobs they like and leaving whenever they want.

In a country like the United States where two incomes are often necessary for a small family to maintain a dignified existence, it may seem unrealistic (and potentially unfair to men) for such a system to be implemented. How can a few men provide for so many people? The answer is Islam’s mechanisms for wealth-preservation and the encouragement of productive investment that ensure the super-wealthy can never get too financially powerful and collude to lower wages as has happened in the United States, and also ensures that a single stream of income is generally enough to feed a large family. These mechanisms, such as the ban on interest and the speculation tax, will  be discussed later on.

There is one flip side to the system that needs to be mentioned. When inheritance is distributed, women receive half as much as men. Since Islam puts all financial duties on men, it rewards them by giving them a larger share of inheritance, as men’s wealth is, after all, also partially women’s, as a man is obliged to take care of all of his close female relatives. Islam, however, doesn’t run away with the idea of a male-provider society by giving all inheritance to men, since not all men can be relied upon to be good and fair care-takers of women. It also doesn’t run away blindly with the idea of equality by giving men and women equal shares of inheritance when it has burdened men with heavier financial duties. It chooses a middle ground between the two extremes. It gives men more duties and a larger inheritance, while also providing a fall-back in case of unfair and undutiful male relatives by giving women a half-share of inheritance.

The virtues and evils of such a system can be debated. Why not give men and women equality in all things? Islam’s view is that men and women are not identical when it comes to all things. It assigns different rights and duties to each sex depending on their particular strengths and weaknesses.

The main issue at question here is this: Is a system that takes the differences between the sexes into account more likely or less likely to be fair, compared to a system that assumes men and women are exactly the same? Is it unimaginable that differentiating between the sexes can lead to a fairer system of rights and duties compared to turning a blind eye to all differences?

Feelings run high when this matter is discussed. The only way to resolve the matter is to undertake large-scale scientific studies to find out whether sex-aware systems lead to better societal outcomes compared to sex-blind systems.

Does it improve the mental health and happiness of women for them to know they will never have to work, and for them to know that there isn’t one chance in a million for them to ever be homeless (given the potentially dozens of male relatives eager and willing to take care of them if they lose their homes or jobs)?

Does it increase or decrease a woman’s chance of career advancement for her not to have to worry about making a living while she focuses on her studies or work? Or is it better to put her in debt and compel her to work as a waitress or bartender so that she can make ends meet while she studies or grows her small business as it is done in the United States?

If we cherry-pick facts and anecdotes, we can make either system look good or bad, but rigorous and empirical comparisons can be done. We can fully resolve the debate through decades of unbiased social research  that compares the outcomes of an Islamic system to competing systems.

Any comparison’s of an Islamic system compared to others will have to take account of IQ, as IQ is the most important factor in determining a population’s prosperity. India is much poorer than China, for example, not largely because of Hinduism versus Communism or Buddhism, but because India’s average IQ is in the mid-80’s, while China’s IQ is above 100. Populations of equal IQ tend to converge toward having the same level of prosperity. China is in the same league as South Korea and Japan when it comes to IQ, so it is practically certain that it will reach the same level of prosperity as these two countries within a decade or two. India, however, is in the same league as the Dominican Republic and Paraguay when it comes to IQ, so as it develops, it will converge toward the same level of prosperity as these two countries. Of course, different population sizes and natural resources will affect things, but not to a great degree, and the larger the populations of the countries that we are comparing, the smaller will the effect of natural resources become. To study this topic further, I recommend the book IQ and the Wealth of Nations by professors Richard Lynn and Tatu Vanhanen.

To have a fair comparison of an Islamic system compared to others, we can compare ethnic Japanese Muslims to ethnic Japanese non-Muslims in Japan (similar IQ, same country) and see how Islam’s system of rights and duties affects the Muslim population compared to the non-Muslim one. Are ethnic Japanese Muslim women happier, more productive, more mentally healthy compared ethnic Japanese non-Muslims, or not?

Unlike Communism, whose adherents can claim that it wasn’t properly implemented when it fails, the Islamic system can be scientifically tested. The requirement is to account for IQ and devoutness (a Muslim who uses credit cards, mortgages and for-profit insurance is not following Islam properly and should not be counted toward the Muslim side). Examples of devout Muslim populations that can be studied are the conservative Muslim middle classes of Egypt and Malaysia. Egypt’s conservative Muslim middle class can be compared to the middle classes of non-Muslim countries of similar IQ (low-80’s), such as Honduras, Nicaragua and the Dominican Republic. And as for Malaysia (IQ 92), we can compare the conservative Muslim middle class there with the middle classes of Greece, Ireland, Bulgaria and Lithuania.

Solve the invisible spaces problem in Word 2013

An annoying issue in Word 2013 is that sometimes the space key seems to stop working, until you press a non-space character, at which point Word deigns to show you both the space and non-space characters.

To solve the problem, press enter to create a new line, then go back to your line. The problem is caused by a bug in Word where having a page break or section break right after the line you are on prevents spaces from showing. Make sure there is a line (empty or not) below the line you are typing on, and the problem disappears.

How to export the entire sequence by default in Adobe Premiere Pro CS6

  1. Move the yellow playback marker far to the right, until it goes into the blank area and the preview window becomes black. If you are doing batch work, move the marker farther than any of your clips are going to be. For example, if you are exporting 1 minute videos, move the marker to the 2 minute mark.
  2. On the bar below the playback marker’s bar, find the right end of the selection bar and move it to the far left, so that there are 0 seconds selected. The left end of the selection marker should also be to the far left, obviously.
  3. That’s all. Now when exporting, Premiere will automatically select the entire sequence for export.

IslamQA: Why there are so few Christian terrorists

Color me curious. Raised Protestant, joined American Navy and saw the world, the Dome of the Rock is a supremely beautiful building. Such beauty, why NO COMPASSION! by radicals? I don't understand the mindset. .. Beauty and hate

The issue is not religion, but politics. Radical Muslims are no different from radical communists. They believe their countries are being controlled and oppressed by evil capitalist tyrants, and that superpowers like the US are supporting the most evil governments on earth (such as in Saudi and Egypt), and that the US is against freedom and democracy if tyrants fit its needs better, all of which are true. For example, the US orchestrated a coup that ended democracy in Iran in the 50′s.

Religion just happens to be a useful tool for these groups, as it gives their followers the courage to die for their cause.

You should also not forget that many terrorist groups are funded by intelligence agencies, both Western and otherwise. If you are an intelligence agency looking to create havoc anywhere in the world, Islamism provides a great tool for this, since Islamist soldiers are brave and do not require the payments needed for hiring non-religious mercenaries.

Many in the Middle East consider ISIS a US-Israeli creation made to perpetuate war in the Middle East and prevent any Muslim country in the area from getting too strong or stable. For all we know, this might be true.

Radical Muslims could just as easily have been Radical Christians. It just so happens that the political situation in the world today has made Muslims the underdogs controlled and stepped on by mostly Christian superpowers. Christians too have a long history of justifying mass violence and murder for their own ends, but since Christians acquired supremacy over the earth after the Middle Ages, and as Christian belief weakened, Christianity stopped being an effective tool for carrying out political goals. A hot-headed Muslim is easy to convince that he is being oppressed, while it is a lot more difficult to convince a Christian, since he knows Christians rule most of the world.

Terrorism is not common among Muslims. A few in 100,000 might condone violence. But everyone ignores the remaining 99999. Why aren’t they terrorists also? Because terrorism is based on political ideas that most Muslims do not support.

Christianity can just as easily be used to create terrorism. But since modern Islamic terrorism was created by Christians (such as in Afghanistan in the 80′s) to accomplish the goals of Christian countries like those of the US in the Middle East, it is Muslims who die for it and Muslims who are mostly killed by it.

Muslim countries do not have the intelligence capacities to organize and support Christian terrorist groups in Christian countries to weaken such countries and create markets for their defense and intelligence industries. It is extremely easy to use Christianity to create terror groups, it just so happens that there is not enough money and power to be gained by the world’s superpowers through Christian terrorism, therefore they are instead spending their billions organizing and supporting Muslim terrorist groups.

And if Islamic belief weakens in the Middle East and stops being an effective terrorist-recruitment tool, the superpowers will simply switch to another ideology, such as communism or a modern incarnation of it. They would then create and organize communist terror groups to perpetuate war inside the countries they want, and Fox News will start talking about the dangerous communists next door who hate you because of your freedom.

AWS Storage Historical Pricing and Future Projections

Some blogs are calling the recent price wars between cloud providers “a race to zero”. But this is the wrong way to think about it. As technology progresses, we simply need to start thinking in terms of larger units.

Here is a table of historical Amazon S3 prices:

Date $/GB/Month $/TB/Month
14-Mar-06 0.15 150
1-Nov-08 0.15 150
1-Nov-10 0.14 140
1-Feb-12 0.125 125
1-Dec-12 0.095 95
1-Feb-14 0.085 85
1-Apr-14 0.03 30

In terms of gigabytes the prices seem to be approaching zero. But in terms of terabytes, the prices are just barely starting to become reasonable. The linear projection below suggests that we will be using terabytes as our unit of choice when speaking of cloud storage until 2020 and later, when prices will start going below $1 per terabyte per month.

Some time after 2020, perhaps around 2025, we will start speaking in terms of petabytes per month.

Fire Phone folder where screenshots are stored

Using my Windows 7 computer to browse the Fire Phone’s files, I found the screenshots in the following folder:

Computer\Fire\Internal storage\Pictures\Screenshots

To take screenshots, you need to hold down the volume down and power buttons together. You will hear a sound and see an animation informing you that the screenshot was successfully taken.

Horoscopes and Islam

A Muslim should believe or read horoscopes or not? Because I saw a post that says the person who believes in horoscopes is a disbeliever.

Horoscopes go under the category of superstition, since there is no basis in science or religion for them. Therefore a well educated and intelligent Muslim should take them for what they are: Fancy-sounding nonsense that impress the gullible.

However, we should not be judgmental toward those who believe in horoscopes. Even though this is an obvious flaw in their faith, we ourselves may have greater flaws that are not so apparent. Those who take pleasure in attacking the obvious flaws of others almost certainly have similar or greater flaws themselves.

We shouldn’t be quick to say who is a believer and who is a disbeliever. We can say a person who is not thankful toward God is a disbeliever; but we all show unthankfulness toward God every now and then; therefore are we to say that we are all disbelievers? We should not pass final judgment on people, that is God’s job, not ours. A person who has a part of disbelief in him or her may also have many parts of belief and goodness that outweigh the disbelief.

List of 20,000 right-angled triangles with whole-number sides

Some mathematical investigations can benefit from having a handy list of right-angled triangles with whole number sides. We know of the common [a = 3,b = 4, c = 5] triangle often used to illustrate the Pythagorean theorem (5^2 = sqrt(3^2 + 4^2)), but sometimes we need more of these. For this reason I made the following lists, placed inside handy text files. They start from the smallest possible triangle (the [3,4,5] one) and iterate up.

List of 20,000 right-angled triangles with whole-number sides sorted by the smallest side (i.e. side a).

List of 20,000 right-angled triangles with whole-number sides sorted by the largest side (i.e. the hypotenuse or side c).