8 Islamic articles on: futurism

On the Impossibility of 1984: Hawramani’s Theological Law of Propaganda

According to the Wikipedia article, propaganda is:

information that is not objective and is used primarily to influence an audience and further an agenda, often by presenting facts selectively to encourage a particular synthesis or perception, or using loaded language to produce an emotional rather than a rational response to the information that is presented. Propaganda is often associated with material prepared by governments, but activist groups, companies, religious organizations and the media can also produce propaganda.

It is the dream of perhaps all governments to produce (a) a coherent, fictive vision of reality (past, present and future) and (b) to convince the populace of the truth of this fictive worldview.

George Orwell’s novel 1984 is an exploration of an imaginary world where propaganda has been taken to its logical conclusion. The government is able to create a reality and implant it in almost every citizen’s mind through a very powerful system of propaganda and control.

Reading 1984 is naturally a depressing experience since there appears to be no realistic reason why such a world cannot eventually come about. As the science of propaganda continues to improve, especially today that it can be enhanced with extremely capable artificial intelligence, governments will continue to be able to exert better control over the minds of citizens.

George Orwell (1903 – 1950)

For an atheist who views the world as a closed system, there is no realistic reason to be optimistic about the future of propaganda. The propaganda system will continue to improve until it reaches a point of singularity where it becomes more complex than any human mind, and thus capable of exerting irresistible influence on human minds. A person can of course refer to chaos theory or quantum uncertainty to say that any system of propaganda can eventually break down due to the simple unpredictability of human thought. But this is just a possibility, and one can still fear the thought that a sufficiently intelligent AI will be able to find ways of handling chaos and uncertainty.

But for a theist, things are much more hopeful. By considering this universe a simulation-like thing (as I discuss in this essay), and by considering the soul an entity that resides outside of it, we are faced with a situation where the complexity of the human can never be overcome. The human soul resides outside the simulation and is independent of it, therefore the simulation can never overcome its complexity. It would be like trying to open a locked box with a key that is inside it.

As is common with all simulations, the infrastructure upon which the simulation runs is more complex than the simulation itself. A video game is a simulation, and the world inside is far, far less complex than the computer upon which the video game operates. The soul belongs to that higher-order world of complexity, therefore it is impossible for anything within our universe to reach its level of complexity. Therefore since (a) the soul is independent of the universe and (b) the soul belongs to a higher-order reality, it follows that (c) no system of information within the universe can match it or overpower it.

Thus Hawramani’s Theological Law of Propaganda is:

No system of propaganda can ever reach the complexity of a single human intellect, therefore humanity is eternally immune from complete control by propaganda.

To put it another way, the dystopian vision of 1984 is unrealistic and impossible. All governments’ efforts at mind-control of the populace are incredibly feeble compared to the object they are dealing with: humans. Humans, by the virtue of having extra-universal souls, are not objects but subjects–subjects that look into the universe from the outside.

Thus as a theist, I can justify complete optimism about humanity’s ability to overcome propaganda.

Of course, I have an even more important reason to be optimistic: God exists, He is in charge, and He will not let any tyrant entirely corrupt His earth:

And they defeated them by God’s leave, and David killed Goliath, and God gave him sovereignty and wisdom, and taught him as He willed. Were it not for God restraining the people, some by means of others, the earth would have gone to ruin. But God is gracious towards mankind.

The Quran, verse 2:251.

IslamQA: What happened to Islamic civilization? Why did Muslims fall behind in science and technology?

I wanted your in depth opinion on a particular observation. Muslims, historically speaking, have been responsible for hundreds and thousands of scientific discoveries. What happened to us? Why are we in the stage we are?

Only 100 years ago, which is just a little more than one human lifetime, the Ottoman Empire was a sovereign Muslim nation that could stand up to any Western power. No Jewish colonizer would have dared to terrorize and massacre Palestinians when the Ottoman Empire was there to protect its citizens.

While many Muslims, including scholars, think that Muslims were always powerful, capable and thriving throughout history until modern times, this is mostly a romantic fairy tale told to console and encourage.

The Crusaders were able to take Jerusalem and other parts of the Levant from the Muslims in 1099 CE and ruled it for nearly 100 years. Where were the great Muslim powers in this time that they couldn’t take it back? The Middle East was a mix of weak and fractured “Muslim” powers, who were only Muslim in name but in general acted like any modern power, using religion to justify their actions while being under the influence and sometimes control of foreign non-Muslim powers.

The current weakness and powerlessness of Muslims is similar to their state during the Mongol invasions. Some Muslims thought the end of the world had arrived, thinking the Mongols were the promised Ya’jooj and Ma’jooj (Gog and Magog) mentioned in the Quran. The Mongols utterly destroyed the Sunni Muslim Khwarezmian Empire which controlled nearly all of Modern Iran, Turkmenistan, Uzbekistan and parts of Afghanistan and Kazakhstan, and which had existed for 150 years, through the wholesale slaughter of men, women and children. After that, they went on to destroy Baghdad and Damascus, although the Abbasid Empire had been in decline for centuries before the Mongols arrived.

On the other side of the Medieval world, Muslims ruled nearly half of Spain for nearly 800 years, until 1492 CE (which is also the year the Americas were discovered). Just as they threw Muslims out of Spain, Christians went on to conquer two continents, spread Christian rule all over them, and eventually built the world’s most powerful nation there.

The Myth of Continuous Power Increase

There is a myth among Muslims that since they belong to God’s chosen religion, they should have been able to establish a globally dominant power that ruled the world forever. But God doesn’t promise us that. He promises that we will be tested:

You will be tested through your possessions and your persons; and you will hear from those who received the Scripture before you, and from the idol worshipers, much abuse. But if you persevere and lead a righteous life—that indeed is a mark of great determination.1

God also threatens us with His ability to remove us from power and replace us with others if we do not follow His guidance:

131. To God belongs everything in the heavens and everything on earth. We have instructed those who were given the Book before you, and you, to be conscious of God. But if you refuse—to God belongs everything in the heavens and everything on earth. God is in no need, Praiseworthy.

132. To God belongs everything in the heavens and everything on earth. God suffices as Manager.

133. If He wills, He can do away with you, O people, and bring others. God is Able to do that. 2

Verse 131 above mention’s God’s warning to the People of the Book. The Old Testament contains many promises by God that if His people disobey, He will abandon them to whatever that may happen to them, and that He will make others dominant over them. In the Book of Deuteronomy (part of the Old Testament, and part of the Torah), prophet Musa (Moses) says:

25 When thou shalt beget children, and children's children, and ye shall have remained long in the land, and shall corrupt yourselves, and make a graven image, or the likeness of any thing, and shall do evil in the sight of the Lord thy God, to provoke him to anger:

26 I call heaven and earth to witness against you this day, that ye shall soon utterly perish from off the land whereunto ye go over Jordan to possess it; ye shall not prolong your days upon it, but shall utterly be destroyed.

27 And the Lord shall scatter you among the nations, and ye shall be left few in number among the heathen, whither the Lord shall lead you.3

The Quran, too, mentions prophet Musa saying similar things:

6. Moses said to his people, “Remember God’s blessings upon you, as He delivered you from the people of Pharaoh, who inflicted on you terrible suffering, slaughtering your sons while sparing your daughters. In that was a serious trial from your Lord.”

7. And when your Lord proclaimed: “If you give thanks, I will grant you increase; but if you are ungrateful, My punishment is severe.”

8. And Moses said, “Even if you are ungrateful, together with everyone on earth—God is in no need, Worthy of Praise.” 4

Our relationship with God is not one where He constantly supports us just because we say we are His nation, unlike some Muslims and many Jews think. Here is the Jewish feminist author Naomi Wolf expressing her surprise at finding out (by reading the Hebrew Bible) that unlike what many Jews think, God does not promise them never-ending support just because they are “His chosen people”:

He never says: "I will give you, ethnic Israelites, the land of Israel." Rather He says something far more radical - far more subversive -- far more Godlike in my view. He says: IF you visit those imprisoned...act mercifully to the widow and the orphan...welcome the stranger in your midst...tend the sick...do justice and love mercy ....and perform various other tasks...THEN YOU WILL BE MY PEOPLE AND THIS LAND WILL BE YOUR LAND. So "my people" is not ethnic -- it is transactional. We are God's people not by birth but by a way of behaving, that is ethical, kind and just. And we STOP being "God's people" when we are not ethical, kind and just.5

She is not quite correct when she says “my people” is not ethnic. Jews are God’s chosen, but being chosen does not necessarily mean one is chosen for a good thing. Jews are God’s chosen in that He gave them many scriptures and throughout the centuries continuously sent them new prophets to guide them back to the Straight Path. He chose them for a specific test. Their being chosen is not just a privilege, it is both a privilege and a heavy burden. If they reject God despite being chosen, God sends the most terrible punishments on them, like He has done many times throughout history. Many Jews forget the burden and choose to enjoy the privilege of thinking of themselves as God’s chosen elite.

Our relationship with God is contractual. If we obey, He supports us. If we disobey, He stops supporting us and subjects us to unfriendly powers.

The story of the Jews is a good lesson for us. Many times in their history they were extremely powerful. After they left Egypt, they entered Canaan around 1446 BCE. They disobeyed God when they were about to overtake a city and live in it, so God punished them by having them wander in the desert for 40 years. They finally entered Canaan in 1406 BCE and completely conquered it by 1399 BCE. Once they become a sovereign power, they soon start to do evil, abandoning God, worshiping Baal or the Calf, practicing usury or allying themselves with irreligious foreign powers like Egypt. For this reason, as they rejected and sometimes even killed their prophets, every few generations God would send a powerful foreign power to destroy many of their cities and slaughter many of their people.

When they continued to reject God, He sent Babylon to conquer their lands and sent them into exile for 70 years. After that the Persian emperor, whose empire had conquered Babylon, allowed the Jews to return to their lands and reestablish themselves there. Their story continued the same as before, with them doing evil and being punished for it. In 70 AD, a few decades after they rejected Jesus and tried to kill him, they tried to escape the rule of the Roman empire. In return they had their city of Jerusalem utterly destroyed and hundreds of thousands of Jews killed.

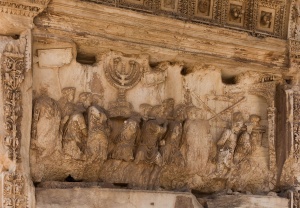
The Arch of Titus, which commemorates the Roman victory over the Jews, among other things, still stands in Rome.

Titus, the Roman commander who was in charge of the Roman victory over the Jews, is supposed to have refused to wear a wreath after the victory, saying that he was only acting as a tool of God’s wrath over the Jews. Perhaps this was God’s punishment on them for their rejecting God’s prophet Jesus.

In Jewish history there is an important historical lesson; that just because a nation associates itself with God and claims to be His people does not mean they will always have God’s support.

Muslim nations have had a history similar to that of the Jews. Many powerful Muslim states have risen and fallen throughout history, and this process is not going to end. If we establish a caliphate like some Muslims dream about, and even if it rules the world for 1000 years, if most of the population abandons Islamic values and Islam becomes largely culture and tradition and not faith, then that caliphate too will fail. God will enable another Mongol invasion, or another invasion by the British and the French, to come and divide their caliphate and do with it as they please.

Christianity’s Place in Islamic History

Just as Islam faded in the Middle East and became little more than cultural tradition and ceremony, Christianity rose in the West. The Christians who conquered the Americas thought they were doing it for God’s sake. They read the Bible daily, they established Biblical law in their colonies, and they braved many dangers in order to establish families, villages and cities in empty and hostile lands.

God’s promise in the Quran came true for them for their deeds:

65. Had the People of the Scripture believed and been righteous, We would have remitted their sins, and admitted them into the Gardens of Bliss.

66. Had they observed/enforced the Torah, and the Gospel, and what was revealed to them from their Lord, they would have consumed amply from above them, and from beneath their feet. Among them is a moderate community, but evil is what many of them are doing.6

While it is common for many Muslims to think of Christians as nothing but heathens who should magically disappear now that Islam has come, Christians are as much God’s people as Muslims are, that is, they too have a contract with God, and if they uphold their contract with God, God will uphold His contract with them. If a Christian nation is more faithful, more eager to serve God, and more observant of God’s laws, then we shouldn’t be surprised if God gives them His full support.

This was the case in the Americas and much of Western Europe until 1900 CE. With all of the corruption present, the average person’s actions and thinking were still largely controlled by Christian ideals.

Today, things are different. The West has finally abandoned the religion that made it great. The only reason the West is great today is the momentum of the past. A Muslim may lose hope when they look at the United States and see its immense capacity to dominate and do evil throughout the world. But the United States is already past its prime. It is desperately trying to hold onto its past power, constantly threatening Russia, China and Iran, but incapable of doing anything about them as they continue to rise.

The United States has had a below-replacement fertility rate since the 1970’s. If it wasn’t for their continuous importation of immigrants, their population would have been shrinking by now. A decades-long below-replacement fertility rate is all that is needed to illustrate that a nation is failing.

It is a country’s population that gives a nation its economic, technological and military power, and once the population starts to shrink, its power will decrease, because there will be fewer people to innovate, and fewer people to consume the fruits of these innovations and in this way pay for further innovations. Today the United States can afford to spend hundreds of billions of dollars on military spending every year, and it is this spending that enables various military companies to continue innovating. But as the American tax base and economy both shrink, with this its power to spend will shrink. America is on a trajectory to become the next Portugal, once a global superpower, now almost a complete non-entity (unless it continues to import immigrants, but this cannot go on forever).

One illustration of the continuing fall of the United States is that of the world’s top 15 skyscrapers (those higher than 350 meters) finished in the past 3 years, 10 are in China, and only one in the United States. China continues to rise, the United States continues to stagnate and fall. America’s failing economy has no need for new office buildings, hotels and restaurants, since it already has more than its shrinking economy needs.

The answer to the question of why Muslims are so powerless compared to the West these days is that Islamic history ran into Christian history. Christian power was still rising when it clashed with an Ottoman Empire that was already past its prime, so the Ottomans didn’t stand a chance.

Today, Christian powers too are past their prime, and great change is coming.

The United States is unlikely to become a Portugal any time soon, and if Islam continues to spread, it might change into a new type of superpower without becoming irrelevant.

It should be noted that while China’s rise will probably be a good thing in the short-term, as its rise to power will probably prevent further significant US excesses for the next few decades, once it is firmly established as the world’s most powerful country, it could start acting like the US, forcing every other country to either become a de facto client state or get turned into a war zone.

The Long View of History

Even if Muslims establish a new global superpower that lasts for hundreds of years, it too can eventually fail and get conquered by non-Muslim powers. Imagine if this world continues to exist for the next 100,000 years. The story of Muslims being powerful then weak then powerful again might play out fifty or a hundred times more.

We humans want safety and security. We want to establish Paradise on Earth once and for all and then go on living in it. But that is not the purpose of this world, and dreams of establishing a Paradise on Earth are naive and futile. We are taught over and over again in the Quran that this world is worthless, that it will soon be over, that none of our deeds done in this world will last. The Quranic character Dhul Qarnain shows his appreciation for God’s message when he says the following right after completing building a structure for God’s sake:

He said, “This is a mercy from my Lord. But when the promise of my Lord comes true, He will turn it into rubble, and the promise of my Lord is always true.”7

For us Muslims, it is always about the journey, not the destination. It doesn’t matter what we accomplish in this world, because nothing we do will last. Everything we think we can accomplish, if God is really all-powerful, God can accomplish it in an instant if He wants. The point is not accomplishment in itself, the point is to follow God. What matters is the record of our deeds. No matter what we build, no matter how much power we have, we could see it all destroyed tomorrow. This has happened over and over again in history, though sadly we continue to fail to learn the lesson.

Why did God let the Mongols destroy Baghdad and Damascus if our purpose was to continue to gain power, wealth and fame in this world? Why did He let the Ottoman Empire, the last truly sovereign Muslim power, be invaded and destroyed? Why did He not allow the Arab powers to defeat Israel during their multiple wars?

Because this world is a test. It is not our purpose to build Paradise on Earth. Our purpose is khilafah, literally “to be stewards”. We are stewards of the earth. Our purpose is to take care of it by enjoining good and admonishing against evil, so that humanity continues, and so that the the earth does not become entirely corrupted.

A steward takes care of a farm until the owner returns, continuing the running of the farm as best as they can. It is the owner’s business what they do with the farm. In the same way, our job in this world is to continue be God’s stewards, God’s agents for good in this world, but it is His business what He does with this world, and whether He gives us power or takes it away from us. All that we can say is, “We hear and we obey.”

We are not seekers after power. The Prophet (peace be upon him) did not seek power, it was given to him. Neither did any of the righteous Rashidun caliphs. We do not seek to establish global dominance, or to carry out global war. Our job is to be God’s stewards, to walk on the Straight Path.

Being on the Straight Path does not require gaining power, and in fact the seeking of power is directly opposed to it, for the seeking of power always requires that one abandon one’s moral integrity. This is the story of every political party that starts out with high moral ideals only to become a nest of corruption and evil.

It is God who gives us power if we deserve it, and if the time is right, for His own purposes, and as long as it pleases Him, until He takes it away from us. As for us, we must be thankful and content throughout all of this:

No, but worship God, and be among the thankful ones.8

It is God who manages history for us. We are not in charge, God is.

No calamity strikes except by God’s permission. Whoever believes in God, He guides his heart. God is Aware of everything.9

No calamity occurs on earth, or in your souls, but it is in a Book, even before We make it happen. That is easy for God. That you may not sorrow over what eludes you, nor exult over what He has given you. God does not love the proud snob.10

God does not change the condition of a people until they change what is within themselves. And if God wills any hardship for a people, there is no turning it back; and apart from Him they have no protector.11

God has promised those of you who believe and do righteous deeds, that He will make them successors on earth, as He made those before them successors, and He will establish for them their religion—which He has approved for them—and He will substitute security in place of their fear. They worship Me, never associating anything with Me. But whoever disbelieves after that—these are the sinners. 12

Our job is to do good wherever we find ourselves, to worship God, to be kind and just, to follow His commandments as best as we can, and it is God who will establish us on Earth when He pleases:

God has promised those of you who believe and do righteous deeds, that He will make them stewards on Earth, as He made those before them stewards, and He will establish for them their religion—which He has approved for them—and He will substitute security in place of their fear. They worship Me, never associating anything with Me. But whoever disbelieves after that—these are the sinners.13

We can, of course, be political activists and social critics. We can constantly work toward social justice and the lifting of poverty. But instead of doing these by seeking power first, we do them without seeking power. We do what is right and just and kind toward everyone, and God, if He wishes, can give us power any time He wants.

Ibn al-Jawzi says in his Sayd al-Khaatir (“Quarry of the Mind”):

I reflected upon the envy that exists among scholars, and saw that its source is the love of the worldly life, because the scholars of the afterlife engage in love and do not envy others. What separates the two groups is that the scholars of the worldly life seek power and leadership in it, and they love to accumulate wealth and praise, while the scholars of the afterlife live in seclusion from these things, they fear them and have mercy toward those who are being tested by them.

Truly good and kind people, who fear God and take the afterlife seriously, do not seek power in my experience. Sometimes the right situation arises for a good person to rise and become powerful, as it happened with Saladin. Saladin wasn’t a revolutionary who grabbed power or a politician. He became powerful as part of his job as a military commander, and one thing led to another until he became a powerful ruler.

The writer Frank Herbert says the following in Chapterhouse: Dune, and I find them true from all that I have seen:

All governments suffer a recurring problem: Power attracts pathological
personalities. It is not that power corrupts but that it is magnetic to the
corruptible.

Power attracts the corruptible. Suspect all who seek it.

Scientific vs. Divine Explanations for Islam’s Decline: Islam, Christianity and Indo-European Genes

A mistake many people make, both religious and irreligious, is that when they discover a scientific explanation for something, they start to think that it means that thing is not from God. But it is a principle of God that He will never allow us to have direct evidence of His existence, therefore when God does something, it is always through scientific means, or He makes it appear to be that way. God will not carry out miracles that can be recorded and published on YouTube. The only time that we will have direct proof of the existence of God and the rest of the Unseen is at the end of the world. When the pagans requested that they see an angel before they believe in God, God’s reply was this:

Had We sent down an angel, the matter would have been settled, and they would not have been reprieved.14

If we ever had direct evidence of God’s existence, then there would be no need for faith in God. God does not want that to happen, therefore everything that happens to us must have logical scientific explanations. We can examine Islamic history to find out where things went wrong. But even if we discover every single cause and try to cure it, our success is not guaranteed.

The divine reason for the fall of Muslims is that they abandoned Islam in their hearts, while the scientific reason might be the demographic collapse of the Persian population after the endless flood of Turkic and Mongol attacks that devastated the great Persian-speaking cities of Central Asia (over 90% of Islam’s greatest scholars, thinkers and scientists came from these cities). The divine reasons precede the scientific reasons. If we disobey God, God will bring about logical and scientifically-explainable reasons for our destruction. And if we obey God, and carry out our stewardship in the best manner possible, God will inspire us toward whatever will give us success and power in this world.

Conclusion

As Muslims, our goal in life is not to acquire power, glory or supremacy in this world. Our goal is not to establish Paradise on Earth. We can appreciate technological and scientific accomplishments, and we can work toward them as part of our stewardship on Earth, but we must never lose sight of the fact that ultimately, everything we do is meant to serve God, and that a day will come when all of our worldly works will be destroyed as if they never existed.

In this world, we are stewards of a temporary farm, a farm whose Owner has promised to destroy in the end. We must never get attached to this farm, or seek its improvement or power over it as a goal in itself. We must never get attached to the idea of establishing a global power. Even if we establish one, it too can come and go like every other Muslim power in history. History will continue going in cycles, Muslims will rise to power, fall, and rise again. The only people who achieve success are those who fear God and serve Him in the best way possible. It is only the record of our deeds which lasts forever, everything else is temporary.

If Muslims are weak today, look again in 500 years, and they may be the strongest and most technologically advanced power on Earth. Look again in 1500 years, and they may again be weak,  oppressed and backward. It is God who gives and God who takes. If we are thankful and obedient, He will increase us and improve our station in life, and if we are ungrateful, He can always take it all away from us and subjugate us to others.

Note that I am not saying that Muslims should turn their backs on science and progress. I love science and technology and eagerly follow its news, and I look forward to Muslim societies catching up to Western ones. Last year Muslim-majority Malaysia overtook Japan in its scientific research output per capita, as the graph below shows, and that is a very hopeful sign for the growth of scientific knowledge among Muslims:

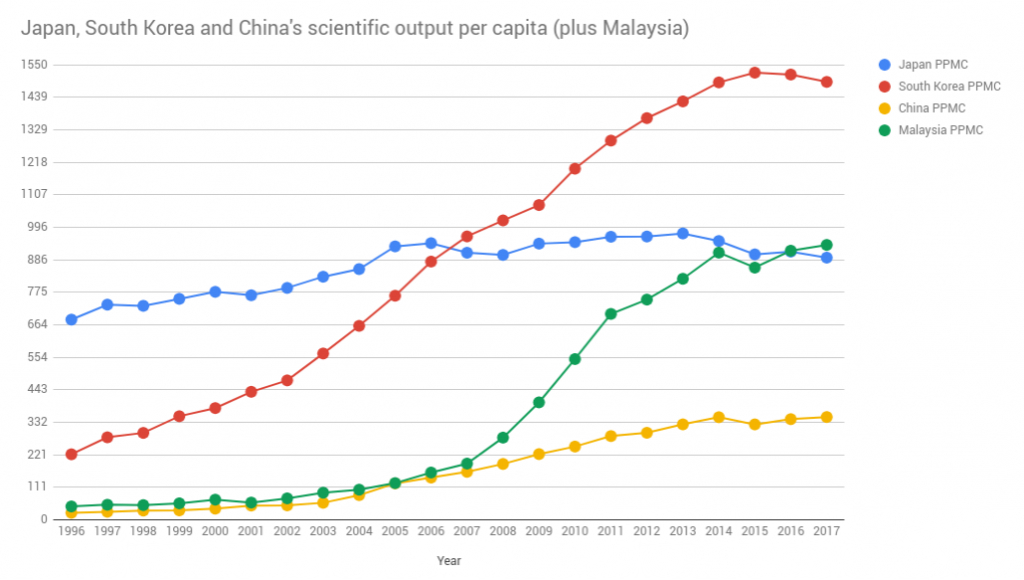
The graph shows the number of scientific research papers published by each country divided by its citizens in millions. In 2017 Malaysia produced 936 papers per million citizen, while Japan produced 892.

Other Muslim nations have shown tremendous growth in scientific research as well. Egypt today produces five times more scientific and scholarly research compared to a mere 15 years ago. Iran is on track to catch up with European countries before 2030. These are things to look forward to, but we should not lose sight of the bigger picture.

Forecasting the World’s Top 50 Most Powerful Countries in 2035 Using the HQI

The following table is a list of 50 countries that are predicted to have the most economic, technological and military power in the world by the year 2035, according to HQI theory. The projected power of the United States is set to 100 to make it easy to compare other countries with it. China’s projected power is 251.6, meaning it will be more than double as powerful as the United States in 2035.

The 2035 populations are projected based on the average of a linear regression of population growth rates between 1995 and 2015. If a country’s population growth rate was 3% in 1995 and 2% 2015, it is assumed that in 2035 the population growth rate will be 1%. The average of the 2015 and 2035 growth rate is taken (1.5%), and this is recursively applied 20 times to arrive at the 2035 population. This is somewhat crude but good enough for our purposes.

The HQI is the Human Genetic-Cultural Quality Index, a measure of a population’s capacity for intellectual achievement and technological innovation, by taking into account a country’s scientific output and real (Smithian) economic growth. China’s HQI is 856 while the HQI of the United States is 1372, meaning each Chinese citizen adds a relative value of 856 to China’s economy, while each American citizen adds a value of 1372. The HQI indicates the “quality” (as opposed to quantity) of the human capital of a country.

By multiplying a population’s count by its HQI, we arrive at a number that indicates the total power for innovation in the population as a whole. In 2035, India will have more people than China (1.52 billion versus 1.46 billion), but since China’s HQI is higher (i.e. since its population is of higher genetic-cultural quality), its power and might will be consequently larger. In fact, China will be five times more powerful than India in 2035, and 2.5 times more powerful than the United States. It will be the most powerful country in the world by a wide margin.

Iran gets an advantage over Russia due to its higher economic growth, fast growing population, and its higher scientific output per capita (25% higher than that of Russia). However, many of Russia’s recent troubles have been due to economic warfare from Wall Street, therefore it is highly unlikely that it will ever be less powerful than Iran. As the HQI is updated over the next few years, Russia’s numbers should improve significantly.

Qatar and Saudi’s high HQI numbers are largely due to their importation of foreign scientists to carry out research in their universities and are not indicative of native capabilities.

It is unlikely that Germany will be less powerful than the United Kingdom in 2035. The HQI of the UK is inflated by the UK’s higher output in the “soft” sciences. Germany actually outdoes the UK in many important scientific fields, such as energy, engineering, physics, astronomy, mathematics and chemical engineering. The UK is superior in medical research.

South Korea produces far more science per capita than Japan, and its economy is growing fast. Both of these factors go toward its much higher HQI compared to Japan (1627 vs. 605). South Korea’s actual advantage may be smaller, and it seems unlikely that it will actually be more powerful than Japan.

How it Works

A country’s HQI shows its potential for growth. It says that after decades of infrastructure-building, urbanization and everything else that goes into producing a developed economy, that country can reach the level of output and innovation that another, fully developed nation of similar HQI has. What this means is that multiplying a non-fully-developed nation’s HQI will give us a number that reflects its power in a few decades, when it has finished developing.

The Chinese population’s HQI of 856 is close to that of Italy’s (945). What this means is that 20 years from now, once China has fully developed, it will have the same economic, military and technological power of an imaginary Italy that has 1.46 billion people. This thought alone should be sufficient to keep those Americans awake at night who think they will forever be the world’s biggest power. Can an America with 364 million people stand up to an Italy with 1.46 billion people? Italy’s 60 million people published 106000 scientific papers in 2015. If that population grows to 1.46 billion, an increase by a factor 24, that means they would likely be able to publish 2.5 million scientific papers per year, dwarfing America’s scientific output of 600,000 papers per year, and with that, dwarfing America’s ability at innovation and technological progress, and its economic and ultimately military power.

That imaginary Italy is very much what China is going to be in 20 years. The HQI of Italy and China are similar. All that remains for China to do to become an Italy with 1.46 billion people is to finish building its economic and scientific infrastructure, and this will probably be done in the 20 years, as the example of South Korea’s development shows.

As for already developed nations, their HQI can be multiplied by the present population to get its present level of power, and it can be multiplied by its projected future population to get its future power. This only makes sense for developed nations. For developing nations like China (and South Korea until recently), the population is high quality, but everything else isn’t, therefore the population is being held back by various factors from achieving what their HQI suggests. For this reason we give these fast-developing nations 20 years to reach their full potential.

Country Projected 2035 Population HQI Relative Economic, Technological and Military Power in 2035
1 China 1,464,562,493 856 250.46
2 United States 364,631,940 1372 100.00
3 India 1,520,438,646 162 49.24
4 United Kingdom 79,223,389 1818 28.79
5 Germany 93,984,408 1218 22.88
6 Australia 31,623,131 3561 22.51
7 France 72,157,368 1165 16.80
8 South Korea 50,400,996 1627 16.39
9 Canada 42,699,016 1859 15.87
10 Brazil 225,917,248 332 14.99
11 Japan 117,049,007 605 14.15
12 Iran 100,194,389 626 12.53
13 Italy 61,510,122 945 11.62
14 Spain 44,357,325 1277 11.33
15 Turkey 101,374,566 479 9.70
16 Russian Federation 149,971,486 312 9.35
17 Switzerland 10,987,401 3910 8.59
18 Poland 37,352,026 1120 8.37
19 Netherlands 18,189,750 2238 8.14
20 Taiwan 22,039,541 1717 7.56
21 Sweden 12,588,464 2775 6.98
22 Saudi Arabia 43,095,570 768 6.61
23 Nigeria 312,375,890 97 6.05
24 Singapore 5,924,284 4823 5.71
25 Malaysia 36,376,961 756 5.50
26 Israel 10,953,808 2410 5.28
27 Egypt 132,313,330 198 5.23
28 Belgium 12,642,382 2058 5.20
29 South Africa 70,569,040 292 4.12
30 Iraq 68,203,001 295 4.03
31 Norway 6,858,738 2925 4.01
32 Austria 10,735,422 1859 3.99
33 Czech Republic 11,684,419 1569 3.66
34 Pakistan 272,264,022 66 3.59
35 Denmark 6,374,946 2812 3.58
36 Mexico 152,508,904 110 3.37
37 New Zealand 6,972,004 2352 3.28
38 Hong Kong 7,811,688 1997 3.12
39 Qatar 4,879,996 2815 2.75
40 Argentina 50,278,252 253 2.54
41 Finland 5,873,345 2034 2.39
42 Portugal 8,783,800 1359 2.39
43 Thailand 68,077,965 174 2.37
44 Chile 21,146,173 535 2.26
45 Ireland 5,233,086 1959 2.05
46 Indonesia 314,805,429 29 1.84
47 Romania 19,228,586 475 1.83
48 Colombia 55,052,245 163 1.80
49 Greece 8,774,644 934 1.64
50 Algeria 58,570,388 129 1.51

Please see my essays on the HQI and the 12-Year Min-Max Average for the fine print regarding how the above numbers were calculated. Most of the data is from the World Bank. Taiwan’s population growth rate was taken from Worldometers.com as it is missing from the World Bank data.

Below is the same table with the nitty-gritty details exposed, and with seven bonus countries at the end. Download it as an Excel file or PDF.

Country 2015 Citable Scientific Documents 2015 Population 1995 Population Growth Rate 2015 Population Growth Rate 2035 Projected Population Growth Rate Projected Annual Population Growth Rate (Mean of 2015 & 2035 Rates) Projected 2035 Population Average Real Annual Economic Growth (2004-2015) [12-Year Min-Max Method] HQI Relative Power in 2035
1 China 416,409 1,401,586,609 1.1 0.5 -0.1 0.2 1,464,562,493 10.5 856 250.46
2 United States 567,007 325,127,634 1.2 0.8 0.4 0.6 364,631,940 0.5 1372 100.00
3 India 123,206 1,282,390,303 1.9 1.2 0.5 0.9 1,520,438,646 7.1 162 49.24
4 United Kingdom 169,483 63,843,856 0.3 0.8 1.4 1.1 79,223,389 -0.6 1818 28.79
5 Germany 149,773 82,562,004 0.3 0.5 0.8 0.7 93,984,408 -0.8 1218 22.88
6 Australia 82,567 23,923,101 1.2 1.3 1.5 1.4 31,623,131 3.0 3561 22.51
7 France 103,733 64,982,894 0.4 0.5 0.6 0.5 72,157,368 -0.1 1165 16.80
8 South Korea 73,433 49,750,234 1.0 0.4 -0.3 0.1 50,400,996 3.6 1627 16.39
9 Canada 89,312 35,871,283 0.8 0.9 0.9 0.9 42,699,016 0.1 1859 15.87
10 Brazil 61,122 203,657,210 1.5 0.9 0.2 0.5 225,917,248 3.7 332 14.99
11 Japan 109,305 126,818,019 0.4 -0.1 -0.7 -0.4 117,049,007 -0.4 605 14.15
12 Iran 39,727 79,476,308 1.4 1.2 1.1 1.2 100,194,389 5.0 626 12.53
13 Italy 95,836 61,142,221 0.0 0.0 0.0 0.0 61,510,122 -1.7 945 11.62
14 Spain 79,209 47,199,069 0.2 -0.1 -0.5 -0.3 44,357,325 0.3 1277 11.33
15 Turkey 39,275 76,690,509 1.6 1.5 1.4 1.4 101,374,566 2.3 479 9.70
16 Russian Federation 57,881 142,098,141 0.0 0.2 0.4 0.3 149,971,486 0.4 312 9.35
17 Switzerland 39,358 8,238,610 0.7 1.2 1.7 1.5 10,987,401 1.0 3910 8.59
18 Poland 37,285 38,221,584 0.1 0.0 -0.2 -0.1 37,352,026 4.2 1120 8.37
19 Netherlands 51,434 16,844,195 0.5 0.4 0.4 0.4 18,189,750 0.0 2238 8.14
20 Taiwan 34,011 23,381,038 0.8 0.1 -0.7 -0.3 22,039,541 4.5 1717 7.56
21 Sweden 35,039 9,693,883 0.5 1.1 1.6 1.3 12,588,464 0.4 2775 6.98
22 Saudi Arabia 17,529 29,897,741 2.6 2.1 1.6 1.8 43,095,570 5.9 768 6.61
23 Nigeria 5,112 183,523,432 2.5 2.6 2.8 2.7 312,375,890 18.2 97 6.05
24 Singapore 17,976 5,618,866 3.0 1.2 -0.7 0.3 5,924,284 7.3 4823 5.71
25 Malaysia 23,414 30,651,176 2.5 1.4 0.3 0.9 36,376,961 3.0 756 5.50
26 Israel 18,040 7,919,528 2.7 2.0 1.3 1.6 10,953,808 3.7 2410 5.28
27 Egypt 14,800 84,705,681 1.9 2.1 2.4 2.3 132,313,330 4.5 198 5.23
28 Belgium 29,180 11,183,411 0.2 0.5 0.8 0.6 12,642,382 0.7 2058 5.20
29 South Africa 17,409 53,491,333 2.2 1.7 1.1 1.4 70,569,040 2.0 292 4.12
30 Iraq 1,793 35,766,702 3.1 3.2 3.4 3.3 68,203,001 27.8 295 4.03
31 Norway 18,228 5,142,842 0.5 1.1 1.8 1.5 6,858,738 1.2 2925 4.01
32 Austria 21,818 8,557,761 0.2 0.8 1.5 1.1 10,735,422 -0.1 1859 3.99
33 Czech Republic 20,759 10,777,060 -0.1 0.3 0.6 0.4 11,684,419 1.0 1569 3.66
34 Pakistan 10,962 188,144,040 2.5 2.1 1.7 1.9 272,264,022 4.6 66 3.59
35 Denmark 23,081 5,661,723 0.5 0.6 0.6 0.6 6,374,946 -0.6 2812 3.58
36 Mexico 18,417 125,235,587 1.9 1.3 0.7 1.0 152,508,904 0.2 110 3.37
37 New Zealand 13,052 4,596,396 1.5 1.9 2.3 2.1 6,972,004 1.3 2352 3.28
38 Hong Kong 14,710 7,313,557 2.0 0.9 -0.2 0.3 7,811,688 3.1 1997 3.12
39 Qatar 2,766 2,350,549 1.2 2.9 4.6 3.7 4,879,996 14.9 2815 2.75
40 Argentina 11,815 42,154,914 1.3 1.0 0.8 0.9 50,278,252 2.2 253 2.54
41 Finland 17,551 5,460,592 0.4 0.4 0.4 0.4 5,873,345 -1.5 2034 2.39
42 Portugal 21,159 10,610,014 0.4 -0.5 -1.4 -0.9 8,783,800 -0.8 1359 2.39
43 Thailand 11,632 67,400,746 0.9 0.3 -0.2 0.1 68,077,965 3.4 174 2.37
44 Chile 10,347 17,924,062 1.5 1.0 0.6 0.8 21,146,173 2.5 535 2.26
45 Ireland 11,370 4,726,856 0.5 0.5 0.5 0.5 5,233,086 1.1 1959 2.05
46 Indonesia 6,280 255,708,785 1.5 1.2 0.9 1.0 314,805,429 5.5 29 1.84
47 Romania 13,053 21,579,201 0.0 -0.4 -0.8 -0.6 19,228,586 0.7 475 1.83
48 Colombia 7,500 49,529,208 1.7 0.9 0.2 0.5 55,052,245 4.3 163 1.80
49 Greece 16,616 11,125,833 0.5 -0.6 -1.7 -1.2 8,774,644 -1.7 934 1.64
50 Algeria 5,171 40,633,464 1.9 1.9 1.8 1.8 58,570,388 3.8 129 1.51
51 Serbia 6,540 9,424,030 -1.4 -0.5 0.5 0.0 9,490,218 3.0 663 1.26
52 Tunisia 6,228 11,235,248 1.9 1.0 0.1 0.5 12,525,418 2.2 493 1.23
53 Hungary 9,478 9,911,396 -0.1 -0.2 -0.3 -0.3 9,408,537 -0.8 653 1.23
54 Viet Nam 4,092 93,386,630 1.6 1.1 0.5 0.8 109,194,988 6.4 55 1.20
55 Slovakia 6,271 5,457,889 0.3 0.1 -0.1 0.0 5,463,349 2.7 1068 1.17
56 Morocco 4,079 33,955,157 1.5 1.3 1.1 1.2 43,445,867 5.0 134 1.16
57 Ukraine 8,868 44,646,131 -0.8 -0.4 0.1 -0.1 43,369,074 -1.4 129 1.12


Measuring Economic and Military Potentials of World Nations with the Human Genetic-Cultural Quality Index (HQI)

Introduction

What is the biggest predictor of a country’s scientific output, industrial capacity and military prowess? It is not geographic size. For instance, Kazakhstan and Mongolia are huge compared to Israel and Switzerland, yet Israel and Switzerland far outdistance them in all measures of intellectual, technological and military attainment.

It is not population. India’s 1.28 billion people are close in number to China’s 1.4 billion. And India has been a West-connected capitalist country since its independence in 1947, while China only started in the 1980’s. Yet China far outstrips India in all measures of technological and military power.

It is not natural resources. Russia has vastly more natural resources than Germany. Yet Germany’s economy is many times that of Russia, and its scientific output is double that of Russia, even though Russia’s population is close to double that of Germany.

The most important predictor of a country’s power and accomplishment is the nature of its population. A country’s most precious natural resource is its citizens. It is the genetic makeup of a population, enabled by supportive cultures, institutions and infrastructure, that predicts the country’s military-industrial power and capacity for innovation.

The book IQ and the Wealth of Nations by the professors Richard Lynn and Tatu Vanhanen makes a powerful argument for the importance of IQ in predicting a country’s power and prosperity, with IQ being a highly heritable (genetically-mediated) trait. While some of the data they use is not reliable, the general force of their argument is undeniable. The data used by Adam Smith and Charles Darwin were none too reliable either, but that didn’t stop their theories from being world-class accomplishments.

IQ is not everything. Japan’s IQ is in the same league as Germany and Sweden. Yet Swedes produce four times more science per citizen than the Japanese (measured in scientific papers published in peer-reviewed journals). Germans produce double the amount of science per citizen than the Japanese. An argument can be made that Japan’s infrastructure has yet to catch up with that of Western Europe. But Japan has had more than enough time (seven decades, in fact) to catch up. And a look at Japan’s infrastructure shows that they might even be ahead of Western Europe when it comes to infrastructure.

The factors that lead to Japan’s low accomplishment relative to Western Europe could be other genetic factors not widely studied. One factor could be Japan’s low testosterone levels compared to Europe, with testosterone being a significant contributor toward the drive for accomplishment1. Another factor could be aging. An aging population is going to be less productive than a younger one. Another factor could be non-genetic; for example cultural practices and ideals, although these factors are not independent of genetics and should be considered together with genetics2.

The Human Genetic-Cultural Quality Index

The HQI, short for the Human Genetic-Cultural Quality Index, takes account of both genetic and cultural factors to accurately predict a country’s real scientific, economic and military potential. It is a measure of the quality of human capital, a nation’s most important natural resource, and provides a single number that can be used to compare the quality of the human capital of different nations.

The math of the HQI will be explained below. For now, I will offer certain examples from it to illustrate the concept. Ukraine has an HQI of 129, while Russia’s HQI is 311. This means that a Russian citizen adds 2.6 times more value to Russia’s economy and scientific output than a Ukrainian citizen adds to Ukraine’s economy and scientific output. The quality of Russia’s human capital is 2.4 times that of Ukraine’s human capital. Even if Russia and Ukraine had exactly the same population (let’s say each had a population of 150 million), Russia would still be 2.4 times as powerful as Ukraine. Today, Russia’s population is 3.15 times as large as Ukraine’s (143.5 million vs. 45.49 million). Multiplying this by the 2.4 times HQI advantage, we arrive at a factor of 7.59. Russia is, or will be, 7.59 times as powerful as Ukraine when both countries reach their near-full development potential, perhaps in the next 30 years.

China’s HQI is 855. India’s is 162. Even if both countries had the same population, China would still be 5.2 times as powerful as India once both countries reach their near-full development potential.

The HQI uses two data points as predicting variables:

  1. Scientific papers per capita, which refers to the number of scientific papers published in a year by the nation, divided by its population. This measures the intellectual capacity of the nation’s population.
  2. Real economic growth rate. When a nation’s economy is growing fast (such as that of China), it shows that the nation’s institutions and infrastructure haven’t reached their full potential. The economic growth rate is used to correct for this fact. For instance, China’s papers per capita is only three times that of India’s. But China’s real 12-year average annual economic growth rate is 10.5%, while India’s is 7%. This means that the economic and scientific potential of China’s human capital has significantly more room to grow than India’s, as will be further illustrated down below.

The (real) economic growth rate of a nation expresses elasticity of human potential for a given nation. If growth is faster, improvements in infrastructure and institutions lead to big gains in the human potential of the nation, i.e. that the human potential of the nation is being held back by infrastructure and institutions, and that as these improve, so will the output of the nation’s human capital.

A slow economic growth rate indicates one of two things:

  1. The nation has reached close to its full potential, so that its human capital is already working at its full capacity. This is the case with slow-growing developed nations like Japan and the Netherlands.
  2. The quality of the nation’s human capital is so low that while theoretically there is much room for growth given the nation’s circumstances, that growth is being held back by human capital that’s not capable of achieving it. This is true in the case of various African and Latin American countries that have everything they could possibly need for growth, except a population that’s actually capable of said growth.

The history of colonization shows the importance of the genetic and cultural factors that go into the HQI. Any nation that becomes colonized by a high HQI population will quickly grow to reflect the home population’s intellectual prowess rather than the native population’s destitution. This has been true in the United States, Australia, Argentina, New Zealand and South Africa.

The most recent example comes from Israel. When Israel was colonized by Ashkenazi Jews that had been selected for high IQ in Europe during their 2000 year stay there3, Israel’s economy quickly grew to reflect a developed European nation, rather than a typical Middle Eastern one. It grew even above Eastern European nations, though it doesn’t seem likely it can surpass Germanic nations, as it has already had all the time and help it needs to achieve this.

The Mathematical Model

For any given nation and year, this is how the HQI basis number is calculated:
With a being the number of peer-reviewed scientific journal articles published in the year, b being the 12-year min-max average of economic growth4 for that year and the preceding 11 years, and c being the population of the nation in that year.

China published 416,409 peer-reviewed scientific journal papers in 2015. Its annual economic growth rate was 10.545 for the period 2004-2015 inclusive. And its population in 2015 was 1,401,586,609 (1.4 billion). The equation to calculate the HQI basis number thus becomes:

This results in a number of 0.001162729158. Since this is not a user-friendly number, the numbers for all nations are all multiplied by the arbitrary value of 735853.761, which gives an HQI of 1 to the lowest HQI country. This provides an easy-to-follow ground to which other countries can be compared. China’s HQI thus becomes 855.59. This means that a Chinese citizen adds a value to China’s economy that is 855.59 times greater than the value added by a citizen of the lowest HQI country to their respective economy (which happens to be the Democratic Republic of the Congo).

Raising the number of a country’s scientific papers to a power of (1 + its economic growth rate) is a mathematical trick that models both of these scenarios:

  1. Scientific output growth that continues at the rate of the country’s past 12-year economic growth rate for the next 11 years.
  2. Scientific output growth that starts off at the country’s average past 12-year economic growth, and then slows down by 6.95% every year over the next 30 years.

The assumption here is that a country’s scientific output will continue growing at the rate of the country’s economic growth over its past 12 years. This may seem a strange assumption, since a country’s future growth cannot be assumed to follow at the same rate as its past growth.

In fact, the correct assumption is that its economic growth will be quite lower. But what we are modeling here is not economic growth, it is growth in scientific output, whose future growth follows along the lines of a country’s past economic growth.

An example will make this clear. South Korea’s GDP grew from $771 billion USD in 2004 to $1.14 trillion in 2015 (all in 2000 dollars), a growth of about 48%. During the same period, its scientific output rose from 31182 papers in 2004 to 69469 papers in 2015, a growth of 122%, more than double its economic growth.

The growth in South Korea’s scientific output from 2004 to 2015 is actually similar to its GDP growth from 1989 to 2003 ($332 billion to $735 billion, a growth of 122%).

In short, scientific output is a lagging indicator of a country’s development, due to the amount of past investment necessary for its growth. No matter how much a country invests into increasing its scientific output, the tangible fruits of said investment will be over a decade in the future. The exception being countries like Saudi Arabia who rapidly increased their scientific output by importing foreign scientists.

India’s scientific output grew from 33031 papers in 2004 to 113144 papers in 2015, a growth of 242%. During the same period, its inflation-adjusted GDP grew from $0.971 trillion to $2.03 trillion, a growth of 109%. The growth in its scientific output was more than double the growth in its economic output.

Its growth, in fact, was similar to its GDP growth from 1981 to 2003. The reason for its slow economic growth over this period may have been its low-effectiveness gene-culture (low IQ, etc.), and its low urbanization rate accompanied by its vast size, that meant it took far longer than South Korea to build the infrastructure and institutions necessary to support effective scientific research.

This phenomenon of scientific growth growing far faster than economic growth can be seen throughout the world. Needless to say, a more rigorous study of the relationship between scientific output and past economic growth can be done. But we can take it as a general rule that past economic growth predicts future scientific output growth.

China’s Coming Supremacy

Raising China’s 2015 scientific paper count of 416409 to a power of 1.105 (1 + its annual economic output growth over 2004-2015) results in 1620204, or 1.62 million. What this means is that once China reaches close to its full economic potential (perhaps after 2030), it will be producing about 1.62 million scientific papers every year. Compare this to the 567000 scientific papers published by the United States in 2015, which, according to the same HQI calculation, will grow to 606000 during the same period. In other words, in the next 20 or more years, China’s scientific output will be 2.67 times as large as that of the United States.

While this may sound controversial to someone who has been wooed by the nascent racism of neocons, globalists and central bank usurer economists in their propagandizing the idea that the US can somehow maintain a permanent technological edge over China, that despite China’s enormous growth and a scientific output that is closely approaching that of the United States, that there is something wrong with the Chinese that will forever keep them as second-class citizens on the world stage, to someone who understands the history of Japan and South Korea’s growth, and who understands the realities of the gene-culture, this conclusion of China’s approaching supremacy is merely stating the obvious.

Using the HQI for Comparative Study of Gene-Cultures and National Potentials

Below is a list of the world’s highest HQI nations (the full list is at the end), for the reader’s viewing pleasure, and to help you follow along the rest of the essay.

Rank Country 2015 Citable Scientific Documents 2015 Population Average Real Annual Economic Growth (2004-2015) [12-Year Min-Max Method] HQI Predicted Scientific Output at Near-Full Potential (2035 and After)
1 Singapore 17,976 5,618,866 7.32 4823 36,824
2 Switzerland 39,358 8,238,610 1.01 3910 43,774
3 Australia 82,567 23,923,101 2.99 3561 115,764
4 Iceland 1,365 336,728 2.41 3549 1,624
5 Norway 18,228 5,142,842 1.17 2925 20,445
6 Qatar 2,766 2,350,549 14.88 2815 8,991
7 Denmark 23,081 5,661,723 -0.65 2812 21,633
8 Sweden 35,039 9,693,883 0.41 2775 36,556
9 Monaco 129 38,320 1.64 2683 140
10 Luxembourg 1,692 543,261 1.51 2564 1,893
11 Israel 18,040 7,919,528 3.71 2410 25,938
12 New Zealand 13,052 4,596,396 1.25 2352 14,693
13 Netherlands 51,434 16,844,195 -0.03 2238 51,239

While the Qatari population have a higher IQ, and are more liberal, than most other Arab populations (perhaps with the exception of Lebanese Christians), their high HQI is strongly a result of their importation of foreign scientists on the one hand, and their fast growing oil revenue on the other, the latter funding the former.

Germanic nations have the highest HQI in the world. Switzerland and Iceland, with their relatively low immigration rates, show the high productivity of Germanic genes and cultures. Australia, Denmark, Norway, Sweden, New Zealand and the Netherlands, with their Germanic roots, follow along the same lines.

The table shows how the HQI can be used to compare the genetic-cultural quality of any two countries. Iceland’s HQI of 3548, divided by the 2238 HQI of the Netherlands, results in a 58% advantage for the Icelandic people. Icelandic people are 58% more capable and productive than Netherlanders, and if the two countries had the same population, Iceland would be 58% more powerful militarily, technologically and economically.

Israel’s high HQI is influenced by its high economic growth, a large portion of which comes from its cozy relationship with the United States (US intelligence agencies, for example, are reliant on many Israeli technology companies). It’s highly unlikely that its population is more capable than that of the Netherlands or New Zealand. This shows that the HQI is not immune to aberrations, similar to all other methods, as reality is full of aberrations caused by disasters, sanctions, wars and political changes.

But regarding Israel, the HQI shows one very important result: Israel is already close to its full scientific potential. Over the next 30 years or so, its scientific output can grow from 18040 papers to 21631. No great improvement can be expected from Israel, and given its precarious political situation, even this much growth may not be possible, though stranger things have happened.

Changes in HQI Reflect Fundamental Genetic-Cultural Changes in a Nation

Far more interesting than a country’s economic growth is HQI growth. The HQI itself is a measure of growth potential, HQI growth means growth in the growth potential. When a nation climbs toward a peak in achievement, economic growth refers to this climb. HQI growth refers to an increase in the height of the peak, a removal of constraints that prevent a nation from reaching the heights reached by other nations.

China’s 2015 HQI was 6.4% lower than its 2010 HQI. This means that between 2010 and 2015, there were some forces in effect that reduced China’s genetic-cultural fitness, or economic fitness, so that while it continued to grow fast, its predicted near-full potential decreased. This was mostly caused by a large drop in the number of scientific papers published by China in 2015. I have contacted SCImago to find out whether this change was due to changes in their paper counting methodologies or whether it was due to a real drop in China’s output. If it was a real drop, maybe it was due to China’s best and brightest aging and retiring, or due to growing practice of usury creating a Western European-style of stagnation faster than expected, or due to some unknown dysgenic effect.

From 2010 to 2015, Ethiopia’s HQI increased by 173%. This is a very, very good sign. It means that there are genetic-cultural changes that are improving the nation’s future potential, or that there are bottlenecks that are being overcome. Not only is the nation climbing toward the peak, the peak itself is growing. Perhaps it is due to improvements in nutrition and health care, or beneficial cultural changes, or both. The actual beneficial change is probably smaller.

Poland has been Europe’s favorite backwater since at least Adam Smith’s time. What does the HQI tell us about what is going on in there? From 2010 to 2015, Poland’s HQI increased by 21.9%. There are forces at work in Poland that are increasing its population’s genetic-cultural fitness, so that whatever we believed Poland’s maximum growth potential to have been in 2010, in 2015 that maximum growth potential was 21.9% higher.

The HQI of the United States decreased by 12.3% from 2010 to 2015. This means that there are forces at work reducing the genetic-cultural fitness of America’s average citizen. One simple explanation could be the increase in immigration from lower HQI nations, who increase the population of the US without significantly increasing its economic and scientific output. Keeping population constant, the HQI still decreased by 8.9%, therefore immigration might be only causing a 3.4 percentage points of this dysgenesis.

Germany’s HQI increased by 0.2% from 2010 to 2015, meaning that no interesting structural change happened. These numbers are from before the recent migrant crisis, whose presence is sure to bring down Germany’s HQI.

Japan’s HQI fell 15.7% from 2010 to 2015. Not only is the nation coming down the peak (through its negative economic growth), the nation’s peak is also decaying.

Russia’s HQI increased by 31.1% from 2010 to 2015. Even though its economic growth was low (0.36%), its scientific output greatly increased during this period, from 38878 papers to 55500. Russia’s seeming low GDP growth is largely due to economic warfare from Wall Street. Its scientific growth shows its true economic fitness.

Why Scientific Output is Important

The HQI uses scientific output as the most important indicator of a nation’s genetic-cultural fitness. There are many good reasons for this, the two most important being:

  1. Producing science requires that a nation be prosperous enough to afford having a class of society who dedicate most of their time to research. And that prosperity can only come from high genetic-cultural fitness for most countries, excepting a few oil states that can afford to import scientists.
  2. Producing science requires very high intellectual capacity and drive for accomplishment (perhaps most importantly IQ and testosterone). If a nation’s population is incapable of producing science, they will be equally incapable of producing high-tech military equipment and industrial innovation, necessary for a nation to increase its power.

A nation’s scientific output is a very good indicator of its fitness. If a nation’s economy is growing fast, by raising the scientific output to the power of its real economic growth, the HQI gives the nation a fair chance at proving itself. China’s scientific output per capita is quite low compared to that of the United States. But its real economic growth is much higher. We can safely assume that China’s per capita scientific output is going to grow at a rate similar to its past economic growth.

The Bottleneck Effect in the Growth of Scientific Output

India’s example shows that there might be a bottleneck effect in the growth of scientific output in large and highly undeveloped nations. As mentioned, India’s scientific output grew by 242% from 2004 to 2015, similar to its economic growth from 1981 to 2003. 12 years of scientific output growth were equal to 23 years of past economic growth. While in the case of South Korea, its 2004 to 2015 scientific growth was roughly similar to its economic growth of the 12 years preceding that.

India may have already overcome the bottleneck. Indonesia, Bangladesh, Pakistan, Nigeria, the Philippines and Vietnam probably haven’t yet, and this probably partly accounts for their low HQI’s.

For a large, undeveloped and already low-HQI nation (low IQ, bad law enforcement, etc.), building the prosperity and infrastructure necessary for doing science takes far longer than it takes a smaller and higher HQI nation. Decades of education, infrastructure building and perhaps most importantly, urbanization, are needed before a country’s scientific output momentum gets going.

List of 203 Sovereign States by Human Potential

Below is a table of 203 sovereign states sorted by HQI, from highest HQI to lowest. Note that the HQI number shows the genetic-cultural quality of each individual citizen within that nation, not the nation’s power. While each additional Singaporean citizen adds a value of 4822 to the economy of Singapore, each additional US citizen adds a value of 1372. Since the genetic-cultural quality of Singaporeans is so much higher than the genetic-cultural quality of US citizens, what the HQI shows is that if Singapore had the same number of citizens as the United States, it would 3.5 times as powerful as the United States, as each individual citizen adds so much more to its power and productivity. Singapore’s real superiority is probably lower, as it is mostly its fast economic growth, aided by its geo-political situation, that’s contributing to its high HQI.

The HQI for certain nations, such as Indonesia and North Korea, are clearly inaccurate due to their exclusion from the world’s scientific community. The HQI of Indonesia and many former Central Asian Soviet states should increase considerably as they start to adopt Western scientific practices.

Please see below the table for the fine print regarding the numbers.

Rank Country 2015 Citable Scientific Documents 2015 Population Average Real Annual Economic Growth (2004-2015) [12-Year Min-Max Method] HQI
1 Singapore 17,976 5,618,866 7.32 4823
2 Switzerland 39,358 8,238,610 1.01 3910
3 Australia 82,567 23,923,101 2.99 3561
4 Iceland 1,365 336,728 2.41 3549
5 Norway 18,228 5,142,842 1.17 2925
6 Qatar 2,766 2,350,549 14.88 2815
7 Denmark 23,081 5,661,723 -0.65 2812
8 Sweden 35,039 9,693,883 0.41 2775
9 Monaco 129 38,320 1.64 2683
10 Luxembourg 1,692 543,261 1.51 2564
11 Israel 18,040 7,919,528 3.71 2410
12 New Zealand 13,052 4,596,396 1.25 2352
13 Netherlands 51,434 16,844,195 -0.03 2238
14 Belgium 29,180 11,183,411 0.68 2058
15 Finland 17,551 5,460,592 -1.55 2034
16 Hong Kong 14,710 7,313,557 3.12 1997
17 Liechtenstein 102 37,461 -0.40 1967
18 Ireland 11,370 4,726,856 1.09 1959
19 Canada 89,312 35,871,283 0.13 1859
20 Austria 21,818 8,557,761 -0.09 1859
21 Slovenia 5,428 2,079,085 -0.43 1851
22 United Kingdom 169,483 63,843,856 -0.60 1818
23 Taiwan 34,011 23,381,038 4.53 1717
24 South Korea 73,433 49,750,234 3.61 1627
25 Greenland 125 57,275 0.05 1610
26 Czech Republic 20,759 10,777,060 1.02 1569
27 United States 567,007 325,127,634 0.51 1372
28 Portugal 21,159 10,610,014 -0.77 1359
29 Macao 819 584,420 3.20 1278
30 Spain 79,209 47,199,069 0.30 1277
31 Estonia 2,620 1,280,227 -2.23 1264
32 Germany 149,773 82,562,004 -0.77 1218
33 France 103,733 64,982,894 -0.08 1165
34 Grenada 140 106,694 3.33 1138
35 Poland 37,285 38,221,584 4.23 1120
36 Cyprus 1,789 1,164,695 -0.51 1088
37 Slovakia 6,271 5,457,889 2.67 1068
38 Malta 559 431,239 0.75 1000
39 Italy 95,836 61,142,221 -1.74 945
40 Greece 16,616 11,125,833 -1.67 934
41 Saint Kitts and Nevis 62 55,376 1.83 889
42 Croatia 5,533 4,255,374 -1.12 869
43 China 416,409 1,401,586,609 10.55 856
44 Saudi Arabia 17,529 29,897,741 5.90 768
45 Malaysia 23,414 30,651,176 2.95 756
46 Brunei Darussalam 366 428,539 1.03 668
47 Serbia 6,540 9,424,030 2.97 663
48 Hungary 9,478 9,911,396 -0.81 653
49 Lithuania 2,973 2,998,969 -1.86 629
50 Iran 39,727 79,476,308 5.02 626
51 Japan 109,305 126,818,019 -0.41 605
52 New Caledonia 171 263,147 3.75 580
53 San Marino 22 31,802 3.26 563
54 Seychelles 59 93,754 3.79 540
55 Chile 10,347 17,924,062 2.50 535
56 Latvia 1,503 2,031,361 -1.23 498
57 Tunisia 6,228 11,235,248 2.17 493
58 Bermuda 43 65,578 0.13 485
59 Palau 14 21,291 -0.22 481
60 Turkey 39,275 76,690,509 2.27 479
61 Romania 13,053 21,579,201 0.70 475
62 Lebanon 2,076 5,053,624 5.60 464
63 Montenegro 316 621,556 2.50 432
64 Dominica 37 72,680 2.90 416
65 Bulgaria 3,441 7,112,641 1.73 410
66 United Arab Emirates 3,858 9,577,128 2.30 358
67 Uruguay 1,208 3,429,997 4.39 354
68 Macedonia 814 2,109,251 3.01 347
69 Barbados 128 287,482 0.83 341
70 Russian Federation 57,881 142,098,141 0.36 312
71 Jordan 2,313 7,689,760 5.45 338
72 Oman 1,461 4,157,783 3.56 335
73 Brazil 61,122 203,657,210 3.70 332
74 French Polynesia 122 282,764 0.11 319
75 Kuwait 1,327 3,583,399 1.84 311
76 Iraq 1,793 35,766,702 27.77 295
77 South Africa 17,409 53,491,333 2.03 292
78 Argentina 11,815 42,154,914 2.17 253
79 Bahrain 344 1,359,726 5.20 252
80 Georgia 1,067 4,304,540 4.28 246
81 Armenia 953 2,989,467 -0.14 232
82 Andorra 24 80,950 -0.26 216
83 Fiji 231 892,727 1.95 212
84 Trinidad and Tobago 285 1,346,697 5.03 207
85 Egypt 14,800 84,705,681 4.49 198
86 Cuba 1,760 11,248,783 6.76 191
87 Bosnia and Herzegovina 756 3,819,684 2.95 177
88 Thailand 11,632 67,400,746 3.39 174
89 Guam 36 169,885 3.00 174
90 Colombia 7,500 49,529,208 4.28 163
91 Belarus 1,554 9,259,666 3.78 163
92 India 123,206 1,282,390,303 7.08 162
93 Azerbaijan 676 9,612,580 17.29 160
94 Botswana 410 2,056,370 1.11 157
95 Panama 485 3,987,866 8.46 151
96 Tuvalu 2 9,916 2.01 150
97 Mauritius 208 1,253,581 3.57 148
98 Kazakhstan 2,062 16,770,447 5.95 142
99 Libya 352 6,317,080 21.21 142
100 Costa Rica 720 5,001,657 3.88 137
101 Cayman Islands 11 59,967 -0.20 134
102 Morocco 4,079 33,955,157 5.00 134
103 Ukraine 8,868 44,646,131 -1.35 129
104 Algeria 5,171 40,633,464 3.75 129
105 Puerto Rico 660 3,680,058 -0.79 125
106 Namibia 286 2,392,370 6.15 125
107 Albania 406 3,196,981 4.32 121
108 Bhutan 82 776,461 10.04 121
109 Mongolia 298 2,923,050 8.01 118
110 Vanuatu 34 263,888 4.84 112
111 Palestine (West Bank & Gaza) 475 4,548,815 6.18 112
112 Mexico 18,417 125,235,587 0.21 110
113 Marshall Islands 7 52,993 0.88 99
114 Nigeria 5,112 183,523,432 18.20 97
115 Ecuador 1,418 16,225,691 4.25 88
116 Bahamas 46 387,549 -0.39 86
117 Federated States of Micronesia 12 104,460 -0.51 83
118 Moldova 348 3,436,828 1.71 82
119 Antigua and Barbuda 10 91,822 0.67 81
120 Ghana 1,531 26,984,328 8.97 81
121 Aruba 12 103,889 -2.26 80
122 Gabon 174 1,751,199 1.72 80
123 Jamaica 305 2,813,276 -0.77 76
124 Congo 388 4,671,142 3.59 76
125 Belize 32 347,598 2.69 74
126 Swaziland 106 1,285,519 2.38 68
127 Sri Lanka 1,255 21,611,842 6.27 67
128 Pakistan 10,962 188,144,040 4.64 66
129 Cape Verde 35 508,315 6.95 65
130 Solomon Islands 43 584,482 4.10 63
131 Gambia 157 1,970,081 1.36 63
132 Peru 1,813 31,161,167 5.10 63
133 Suriname 38 548,456 5.38 62
134 Venezuela 1,473 31,292,702 7.55 60
135 Maldives 22 357,981 7.57 57
136 Viet Nam 4,092 93,386,630 6.40 55
137 Samoa 13 193,228 0.76 50
138 Kenya 2,215 46,748,617 4.32 49
139 Tonga 7 106,379 -0.20 48
140 Saint Lucia 11 184,937 3.25 47
141 Cameroon 1,116 23,393,129 4.09 47
142 Senegal 691 14,967,446 4.22 45
143 Uganda 1,270 40,141,262 7.03 38
144 Laos 226 7,019,652 7.81 36
145 Benin 409 10,879,828 4.30 36
146 Kiribati 5 105,555 1.51 36
147 Guyana 34 807,611 2.53 34
148 Nepal 922 28,440,629 4.73 33
149 Malawi 519 17,308,685 5.75 32
150 Zambia 432 15,519,604 6.76 31
151 Burkina Faso 508 17,914,625 5.81 30
152 Indonesia 6,280 255,708,785 5.49 29
153 Ethiopia 1,691 98,942,102 11.11 29
154 Tanzania 1,261 52,290,796 6.56 28
155 Saint Vincent and the Grenadines 4 109,374 2.15 28
156 Bolivia 290 11,024,522 5.08 26
157 Rwanda 278 12,428,005 7.92 26
158 Paraguay 182 7,032,942 5.04 25
159 Kyrgyzstan 142 5,707,529 5.23 24
160 Syrian Arab Republic 502 22,264,996 5.07 23
161 Equatorial Guinea 17 799,372 12.91 23
162 Zimbabwe 552 15,046,102 -2.88 23
163 Bangladesh 3,011 160,411,249 6.06 22
164 Cambodia 317 15,677,059 6.67 22
165 Philippines 2,091 101,802,706 4.39 21
166 Papua New Guinea 156 7,631,819 6.48 21
167 Togo 156 7,170,797 3.56 19
168 Lesotho 43 2,120,116 5.09 18
169 Uzbekistan 426 29,709,932 8.46 18
170 Sierra Leone 112 6,318,575 6.20 17
171 Guinea-Bissau 37 1,787,793 3.77 17
172 Timor-Leste 23 1,172,668 4.25 16
173 Niger 169 19,268,380 18.20 16
174 Côte d’Ivoire 386 21,295,284 3.16 16
175 El Salvador 135 6,426,002 0.39 16
176 Sudan 597 39,613,217 4.66 15
177 Guatemala 243 16,255,094 3.42 13
178 Mali 239 16,258,587 3.18 13
179 Mozambique 299 27,121,827 8.06 13
180 Nicaragua 100 6,256,510 1.74 13
181 Tajikistan 107 8,610,384 7.05 13
182 Liberia 63 4,503,439 4.92 13
183 Djibouti 13 899,658 4.59 12
184 Yemen 297 25,535,086 4.38 11
185 Dominican Republic 116 10,652,135 5.81 11
186 Madagascar 278 24,235,390 1.56 9
187 Honduras 92 8,423,917 2.07 9
188 Mauritania 35 4,080,224 8.92 9
189 Comoros 8 770,058 1.95 8
190 Haïti 112 10,603,731 0.01 8
191 Sao Tome and Principe 2 202,781 6.19 8
192 Central African Republic 41 4,803,082 3.45 7
193 Guinea 106 12,347,766 2.35 7
194 Angola 83 22,819,926 12.50 5
195 Myanmar 181 54,164,262 10.42 4
196 Chad 38 13,605,625 16.86 4
197 Eritrea 29 6,737,634 3.86 4
198 Burundi 42 10,812,619 1.42 3
199 Afghanistan 74 32,006,788 11.27 3
200 North Korea 52 25,155,326 1.85 2
201 Turkmenistan 9 5,373,487 9.85 2
202 Democratic Republic of the Congo 75 71,246,355 5.92 1

The economic growth rate data comes from my essay The 12-Year Min-Max Average. Please see this essay for technical details on how the numbers were calculated.

Only “citable” scientific documents are counted, citable documents are generally higher in quality and more important than non-citable ones. However, citable and no-citable documents tend to rise and fall together, so that including non-citable documents shouldn’t have a significant effect on the HQI numbers.

Population data comes the United Nations and the World Bank. Scientific output data from SCIMago. Economic growth data from the World Bank and Trading Economics.

* A country’s GDP growth rate could be said to somewhat take into account its population growth, since when all other things are equal, growth in population results in economic growth. However, this will only apply to a stagnant economy whose only increase or decrease is a result of population change rather than

Charting the Strauss-Howe Generational Theory in 2017

Below is a chart (click it to zoom) that shows the seasonality of Anglo-American history since the end of the Middle Ages, according to the Strauss-Howe Generational Theory (as described in their 1997 book The Fourth Turning). Click here to download an enlarged version.

Below is the inner circles zoomed in (for those who don’t want to click the above chart to zoom in):

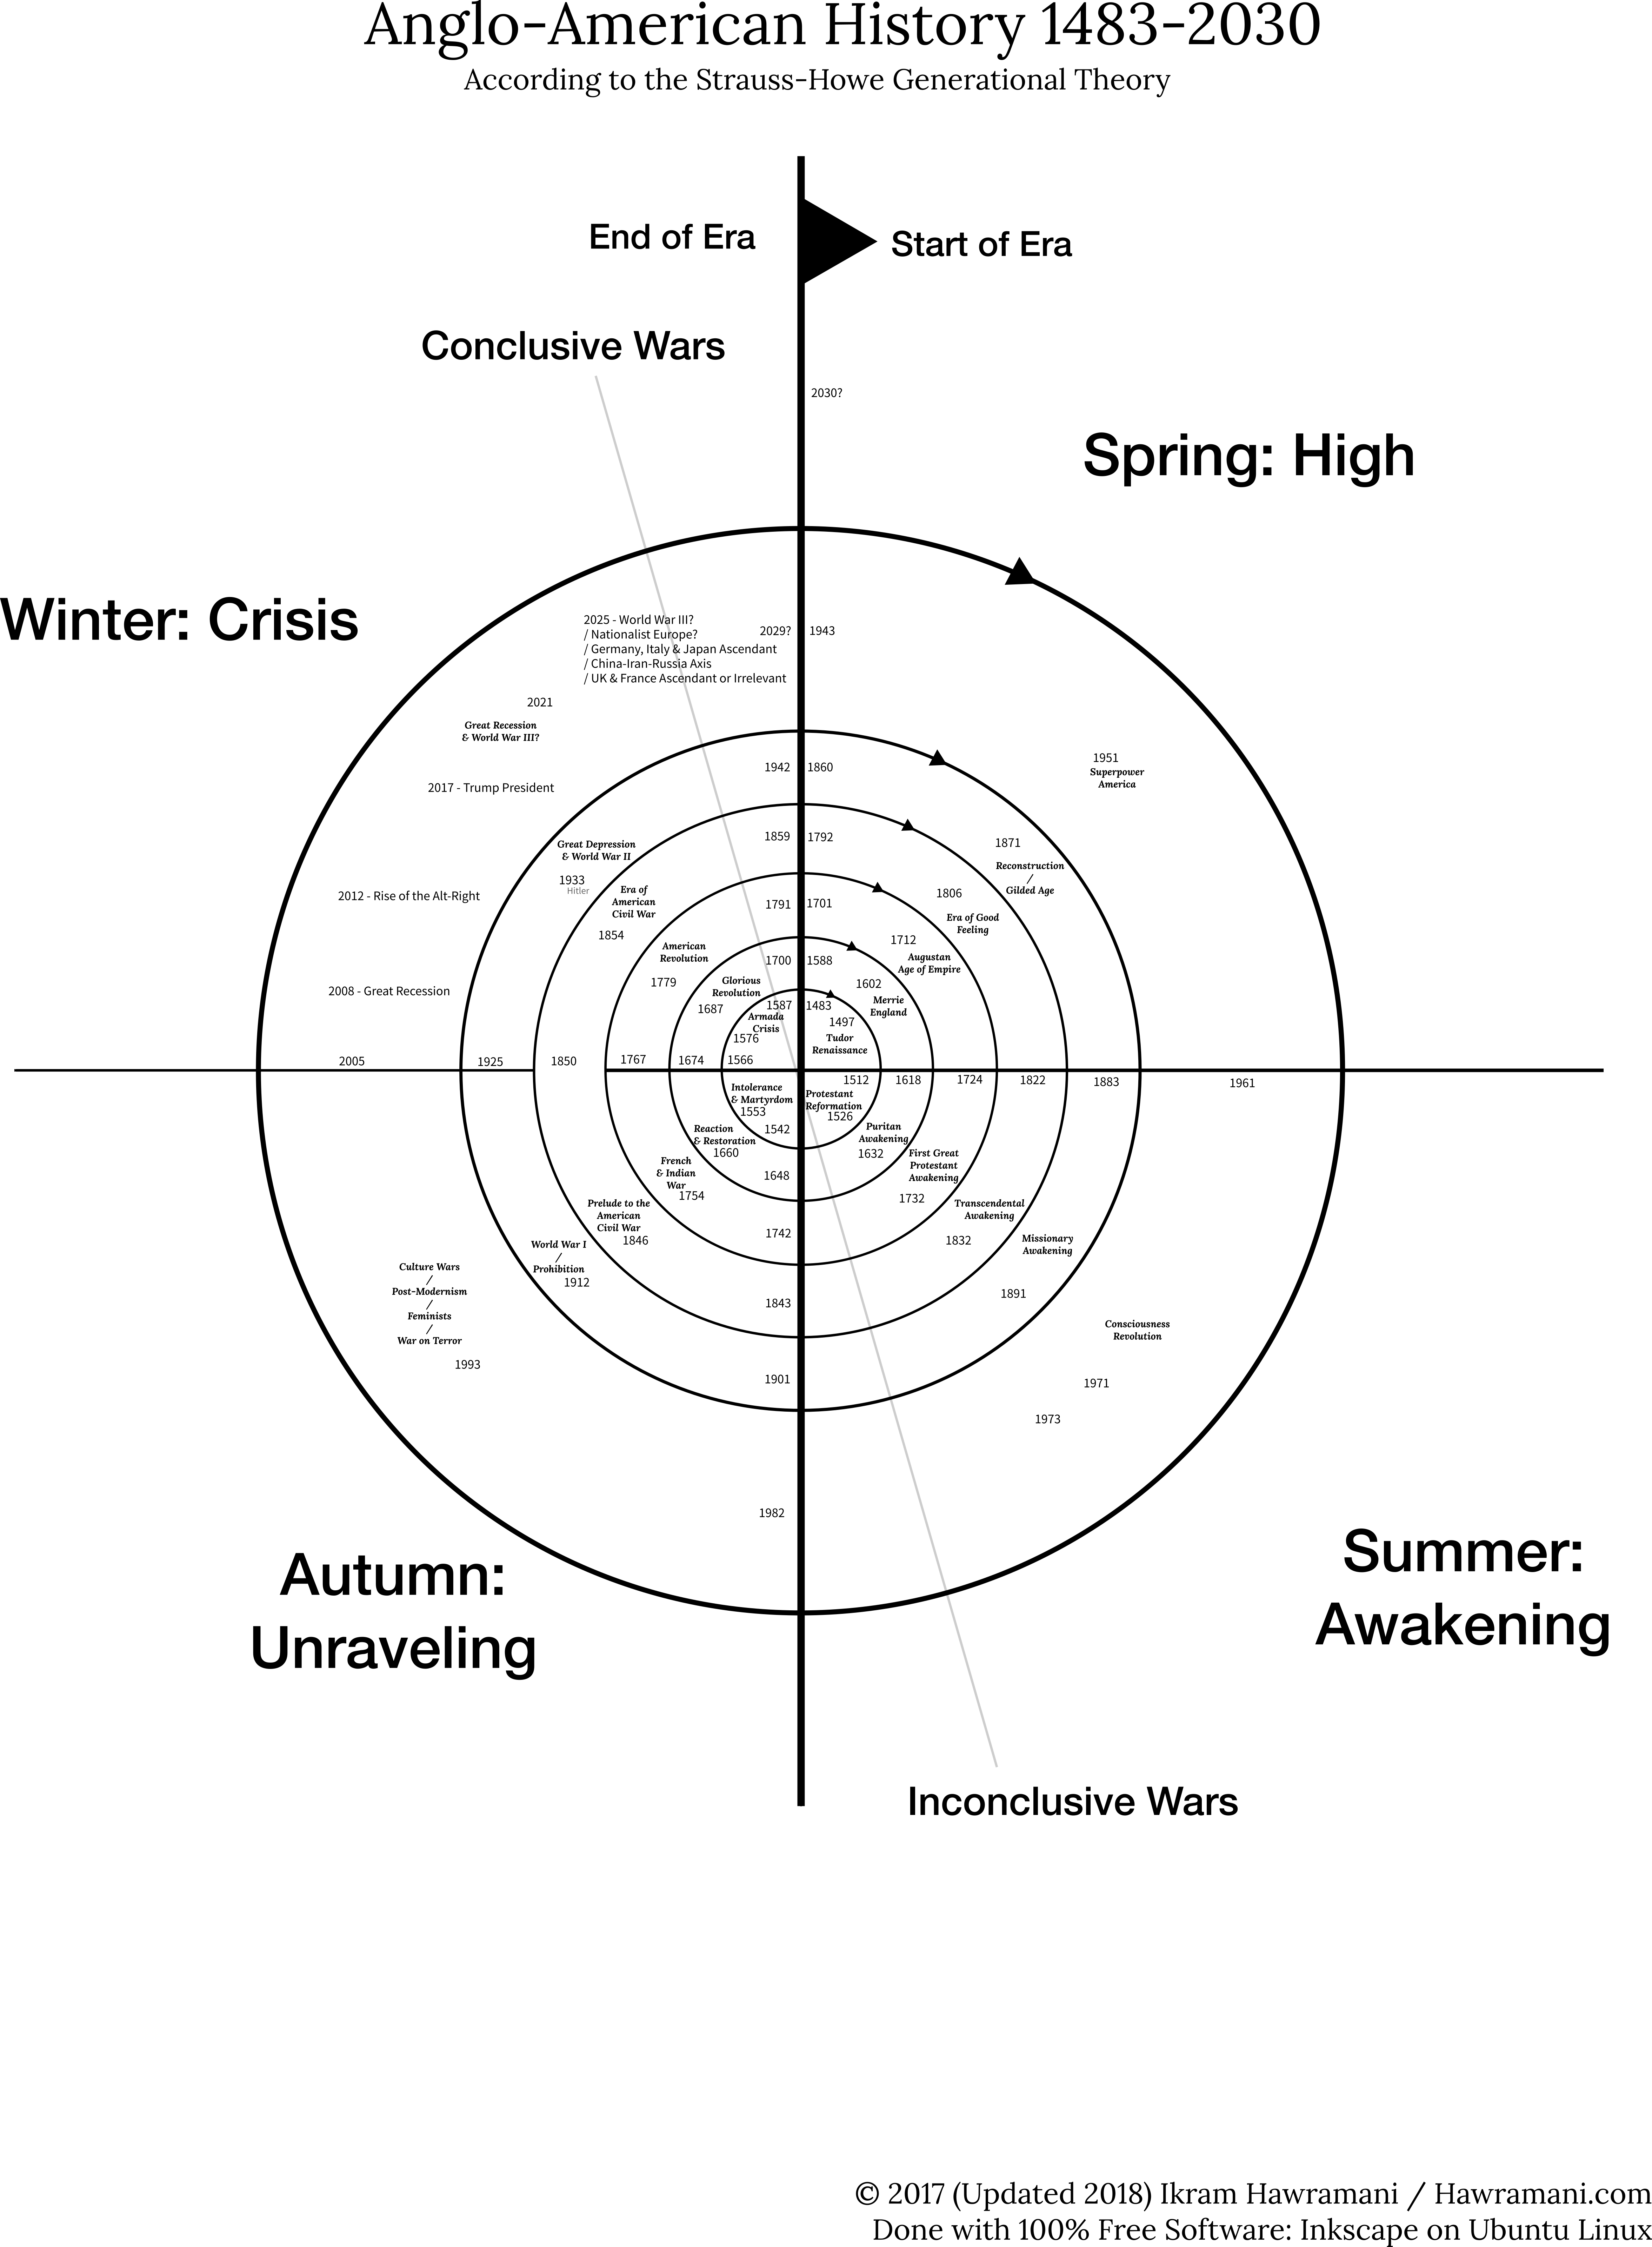
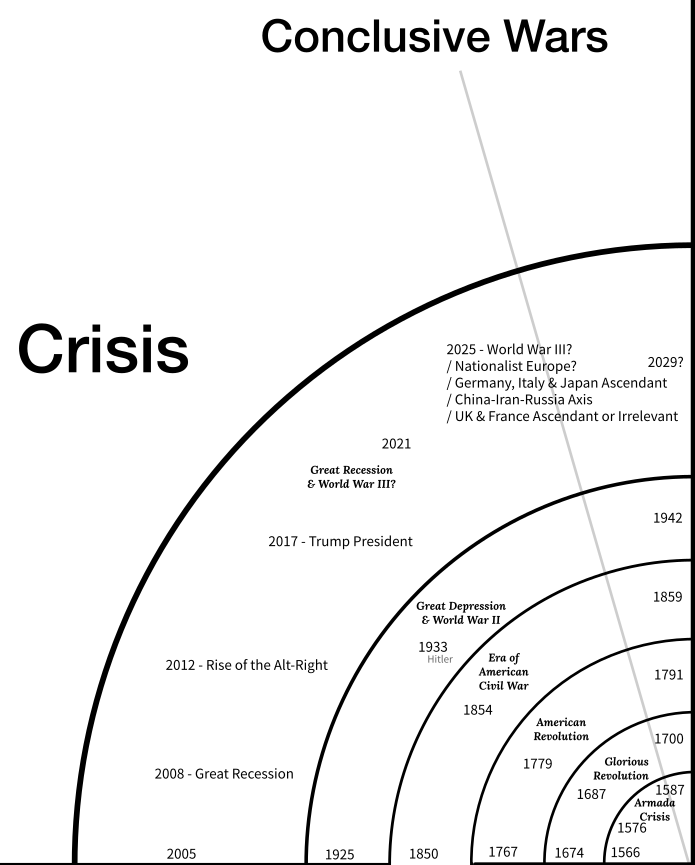
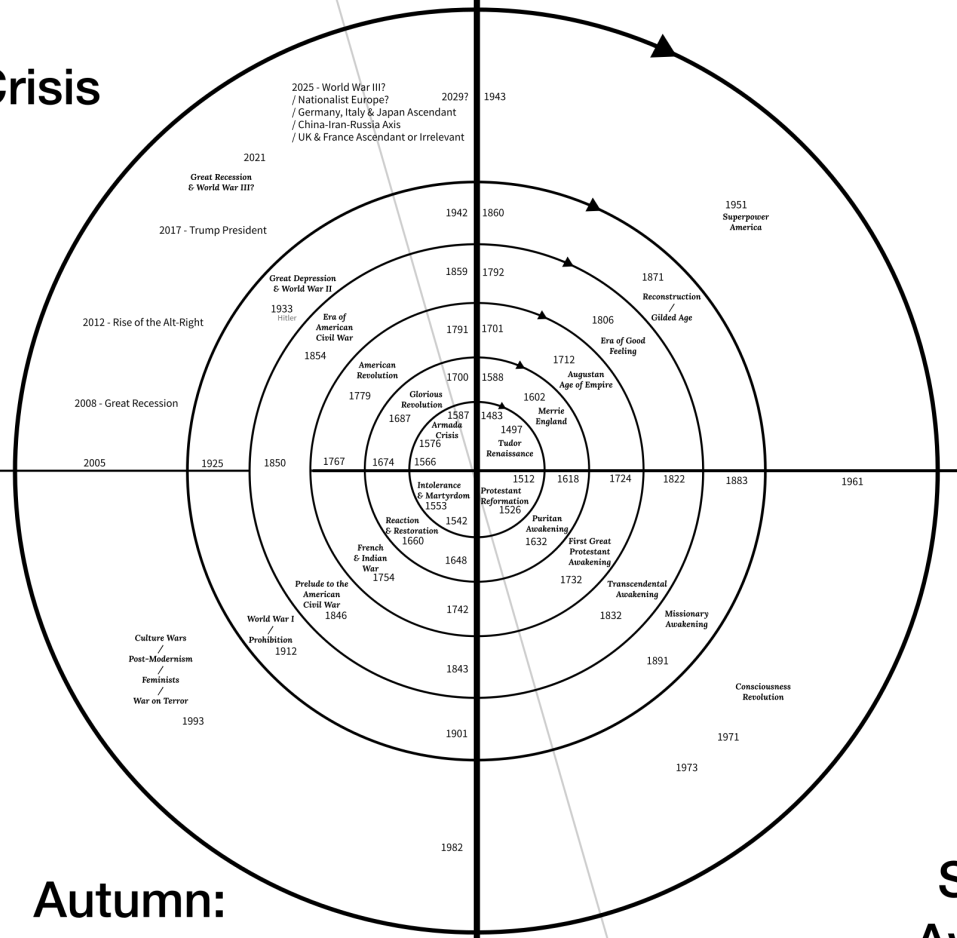
The “saeculum” is the word that Strauss-Howe use for each circle of the chart above, four seasons together make one saeculum. A saeculum is generally the length of one human life time, and its regularity has been noted since ancient times. We are currently living at the end of the saeculum that started in 1943, and which will probably end sometime between 2025 and 2035.

Below is the part of the chart that is most relevant to 2017. Many world leaders feel that we are approaching a major war. Countries are preparing for war, with Russia and China at the forefront, and Japan starting its own re-militarization program. According to the Strauss-Howe theory, 2017 is equivalent to 1933 (when Hitler got in charge and started rebuilding Germany’s army), 1854 (when the prospect of an American Civil War felt more and more imminent), and 1779 (the middle of the American Revolutionary War against Britain, and the year of the French Revolution). Needless to say, right now we are living in very interesting times.

[I updated these charts in 2018.]

When will the average flagship smartphone have a 5000 mAh battery? Probably around 2029

From 2007 to 2016, the iPhone’s battery grew from 1400 mAh in the first iPhone to 1960 mAh in the iPhone 7 (ignoring the new plus size iPhones). The energy density of lithium ion batteries grows at an exponential rate (5-8% a year), doubling every ten years, according to Tesla’s J.B. Straubel. The iPhone’s battery density growth is lagging this trend probably due to the continuous push for thinner phones.

Using Microsoft Excel’s exponential regression functionality, the following chart forecasts future iPhone battery sizes based on the available historical data, predicting that the small (non-plus) iPhone’s battery capacity will reach 5000 mAh around the year 2036:

Moving on to the more interesting new plus-sized iPhones, Excel cannot do an accurate automatic exponential regression due to the fact that there isn’t enough historical data available on the plus-sized iPhones. By examining the above chart and manually doing the regression using a second series, I found that Excel assumed an approximate rate of growth of 3.81%, and an approximate rate of growth of the rate of growth of 0.09%. Using these same rates on current iPhone Plus battery sizes, we get the following chart:

As it can be seen, around 2024 the iPhone Plus battery size reaches 4000 mAh, and around 2029 it reaches 5000 mAh. If the trend toward ever thinner phones slows, then the 5000 mAh smartphone battery might be achieved at an earlier date. I am hopeful that at least one large manufacturer is brave enough to bet on much larger batteries as a selling point, instead of following Apple’s lead in making things thinner and thinner.

When will smartphones have 1 terabyte of storage? Probably around 2021

While I’m no fan of Apple, the iPhone has so far been the leader in performance and storage. The internal storage of Apple’s latest and greatest iPhone provides a good benchmark for the current level of storage of the entire smartphone industry. When an iPhone with a new level of storage comes out, every manufacturer plays catch-up with Apple releases a flagship phone of similar storage.

Here is a chart that shows the trend in iPhone in internal storage. It extrapolates the trend into the future to predict when the iPhone will likely have one terabyte of internal storage (blue is historical storage levels, orange is predicted, and the dotted line is the trendline):

The chart assumes an exponential trend, since storage density and prices have followed an exponential increase and reduction trend.

I assumed that from 2018 through 2020, the iPhone will stay at 512 GB, similar to how it remained at 64 GB from 2011 through 2013. It is possible that instead of this, the iPhone will stay at 256 GB from 2017 through 2019. This will not significantly affect the historical trend.

Here is the same chart with the forecast extended to 2030. The trendline predicts an internal storage of 5 terabytes in 2027 and 10 terabytes in 2029.

I know that 10 terabytes in a smartphone may seem unnecessarily high. But historical trends show that every age can find good (and frivolous) uses for all the storage it can get.

Below is a table of every iPhone release date, device name, highest offered storage and battery capacity:

Release Date
Device Storage (GB)
Battery (mAh)
June 29, 2007 iPhone 1 16 1400
July 11, 2008 iPhone 3G 16 1150
June 19 2009 iPhone 3GS 32 1219
June 24, 2010 iPhone 4 32 1420
October 14, 2011 iPhone 4S 64 1432
September 21, 2012 iPhone 5 64 1440
September 20, 2013 iPhone 5S 64 1560
September 19, 2014 iPhone 6 128 1810
September 25, 2015 iPhone 6S 128 1715
September 16, 2016 iPhone 7 256 1960

AWS Storage Historical Pricing and Future Projections

Some blogs are calling the recent price wars between cloud providers “a race to zero”. But this is the wrong way to think about it. As technology progresses, we simply need to start thinking in terms of larger units.

Here is a table of historical Amazon S3 prices:

Date $/GB/Month $/TB/Month
14-Mar-06 0.15 150
1-Nov-08 0.15 150
1-Nov-10 0.14 140
1-Feb-12 0.125 125
1-Dec-12 0.095 95
1-Feb-14 0.085 85
1-Apr-14 0.03 30

In terms of gigabytes the prices seem to be approaching zero. But in terms of terabytes, the prices are just barely starting to become reasonable. The linear projection below suggests that we will be using terabytes as our unit of choice when speaking of cloud storage until 2020 and later, when prices will start going below $1 per terabyte per month.

Some time after 2020, perhaps around 2025, we will start speaking in terms of petabytes per month.